
Navigating the Research Terminal
Search for any ticker (e.g., HDFC Bank, Reliance) using the top search bar to instantly generate its comprehensive analytics report. The page is broken down into four major analytical categories:1. Price Action & Performance
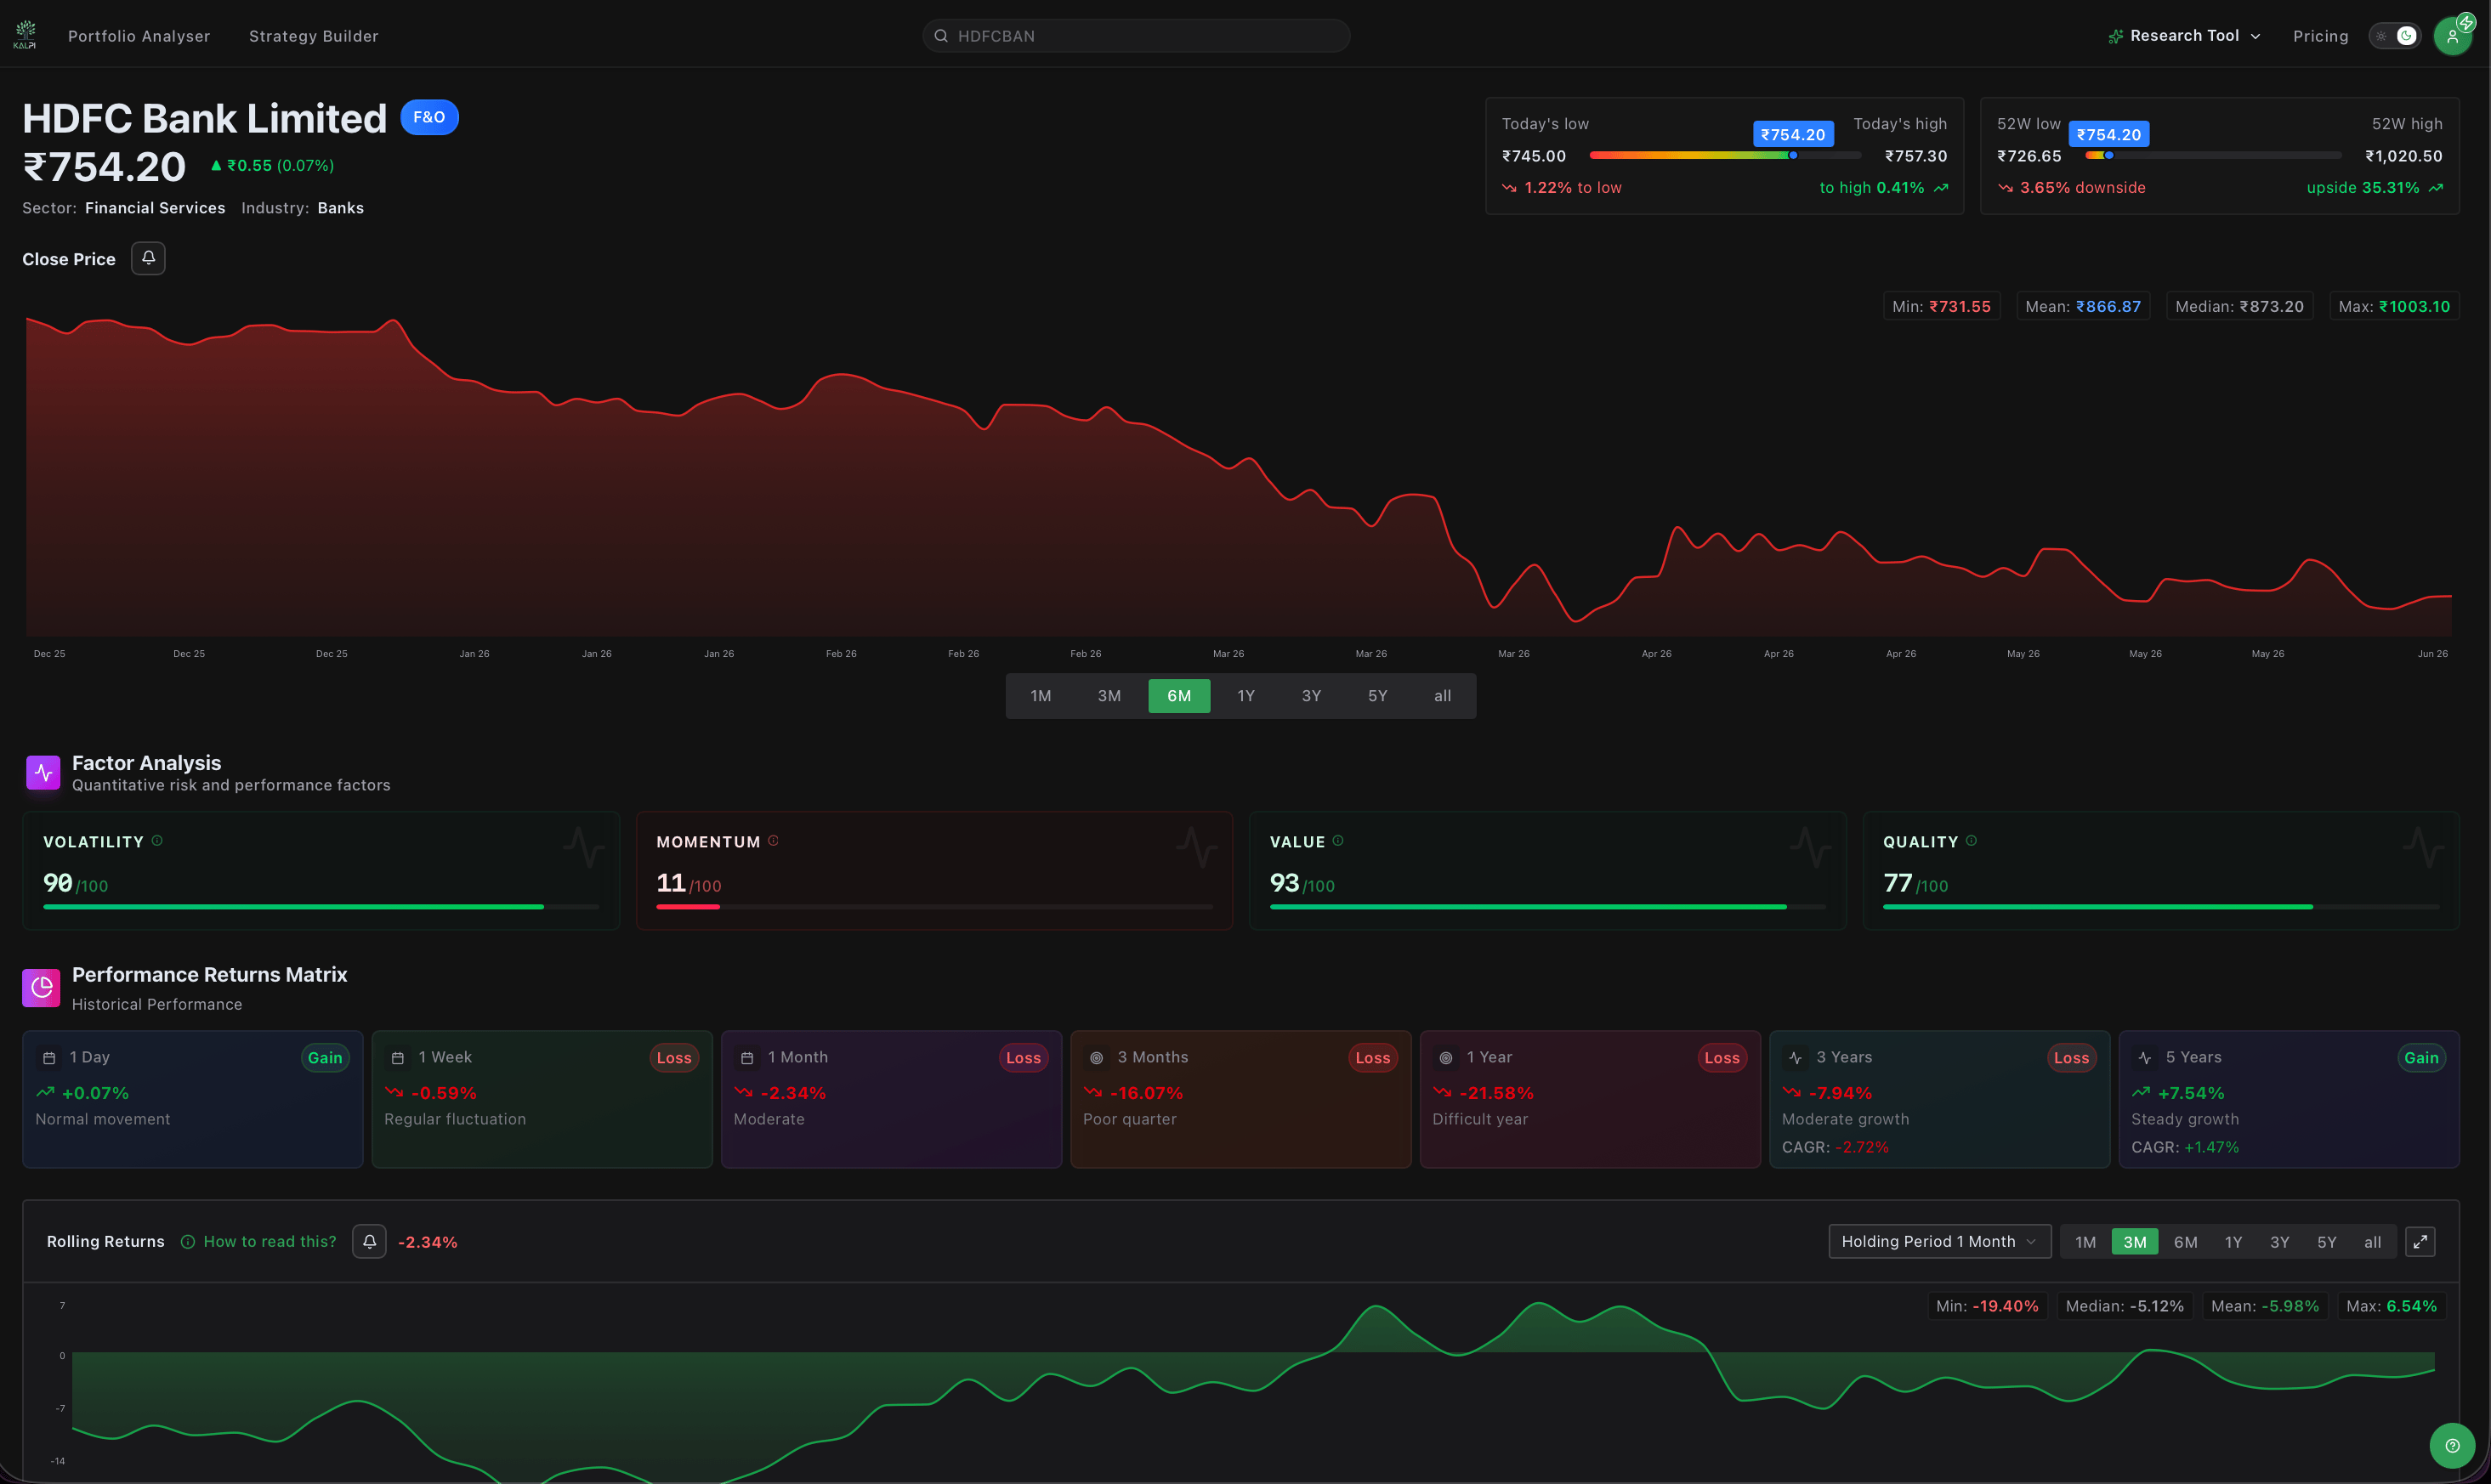
1. Price Action & Performance
Get an immediate read on the asset’s current standing and historical performance.
- Price Range Analytics: Visual progress bars show exactly where the current price sits relative to its daily and 52-week highs and lows.
- Performance Returns Matrix: Track absolute returns across multiple timeframes (1 Day to 5 Years) at a glance.
- Rolling Returns: Interactive charts allow you to visualize the consistency of returns over custom holding periods, helping you understand true historical performance beyond just point-to-point data.
2. Technical Analysis
2. Technical Analysis
Skip the manual chart plotting. Kalpi aggregates dozens of technical indicators into easy-to-read signals.
- Signal Dials: Real-time gauge meters simplify market momentum, offering clear Buy, Sell, or Neutral readings across Oscillators and Moving Averages.
- Indicator Tables: For advanced traders, dive into the exact values and positions of the Average Directional Index (ADX), MACD, Bollinger Bands, RSI, and multiple Exponential Moving Averages (EMA).
3. Quantitative & Statistical Data
3. Quantitative & Statistical Data
Evaluate risk and market correlation like a quantitative hedge fund.
- Risk Metrics: Track rolling Volatility and Sharpe Ratios to see if the asset’s returns justify its risk over time.
- Market Correlation: View the Beta Coefficient to understand how volatile the stock is compared to the broader market, and track its Relative Strength against the benchmark.
- Z-Score Charts: View statistical deviation analysis to instantly spot if a stock is historically cheap, expensive, or experiencing abnormal momentum.
4. Seasonality & Corporate Events
4. Seasonality & Corporate Events
Uncover hidden calendar patterns and stay ahead of critical dates.
- Seasonality Analysis: Does the stock historically crash in October? Kalpi breaks down monthly patterns, identifying the asset’s Best Month, Weakest Month, and overall Positive Return Ratio (win rate).
- Interactive Bar Charts: Filter seasonality data by Average Return, Median Return, and Volatility to perfectly time your entries.
- Corporate Actions: A chronological timeline tracking historical and upcoming dividends, earnings results, and board meetings.