Phase 1: Configuring Your Simulation
Building a statistically sound backtest requires setting up precise architectural constraints. Follow these structured steps within the input interface to configure your model:1
Establish Your Baseline Benchmark
Select the core comparative baseline index (e.g., Nifty 50, Nifty Energy, Nifty Financial Services) against which your portfolio’s alpha generation will be directly measured.
2
Define Rebalancing Frequency
Specify how often the engine should mathematically re-align your asset allocations back to their target constraints. Choose from:
- Never (Buy & Hold): Assets drift naturally based on price action.
- Monthly / Quarterly / Yearly: Automated programmatic re-allocations to lock in gains and manage risk concentrations.
3
Select the Historical Time Horizon
Open the Configure Dates module to input your custom simulation start and end parameters. This boundary sets the exact structural window your strategy will navigate.
4
Curate Positions & Optimize Weights
Input your target equity symbols into the holdings table. To instantly remove calculation errors, utilize the green Distribute Equally utility to split allocation percentages perfectly evenly across all assets (e.g., mapping 4 assets to exactly 25.0% each). Once optimized, execute the simulation by clicking Analyze Portfolio.
Phase 2: Evaluating the Analytics Suite
Once calculation concludes, the interface generates a specialized, comprehensive analytics report broken into individual high-end tabs. Click through the diagnostic scopes below to explore each analytical matrix:- Overview & Fundamentals
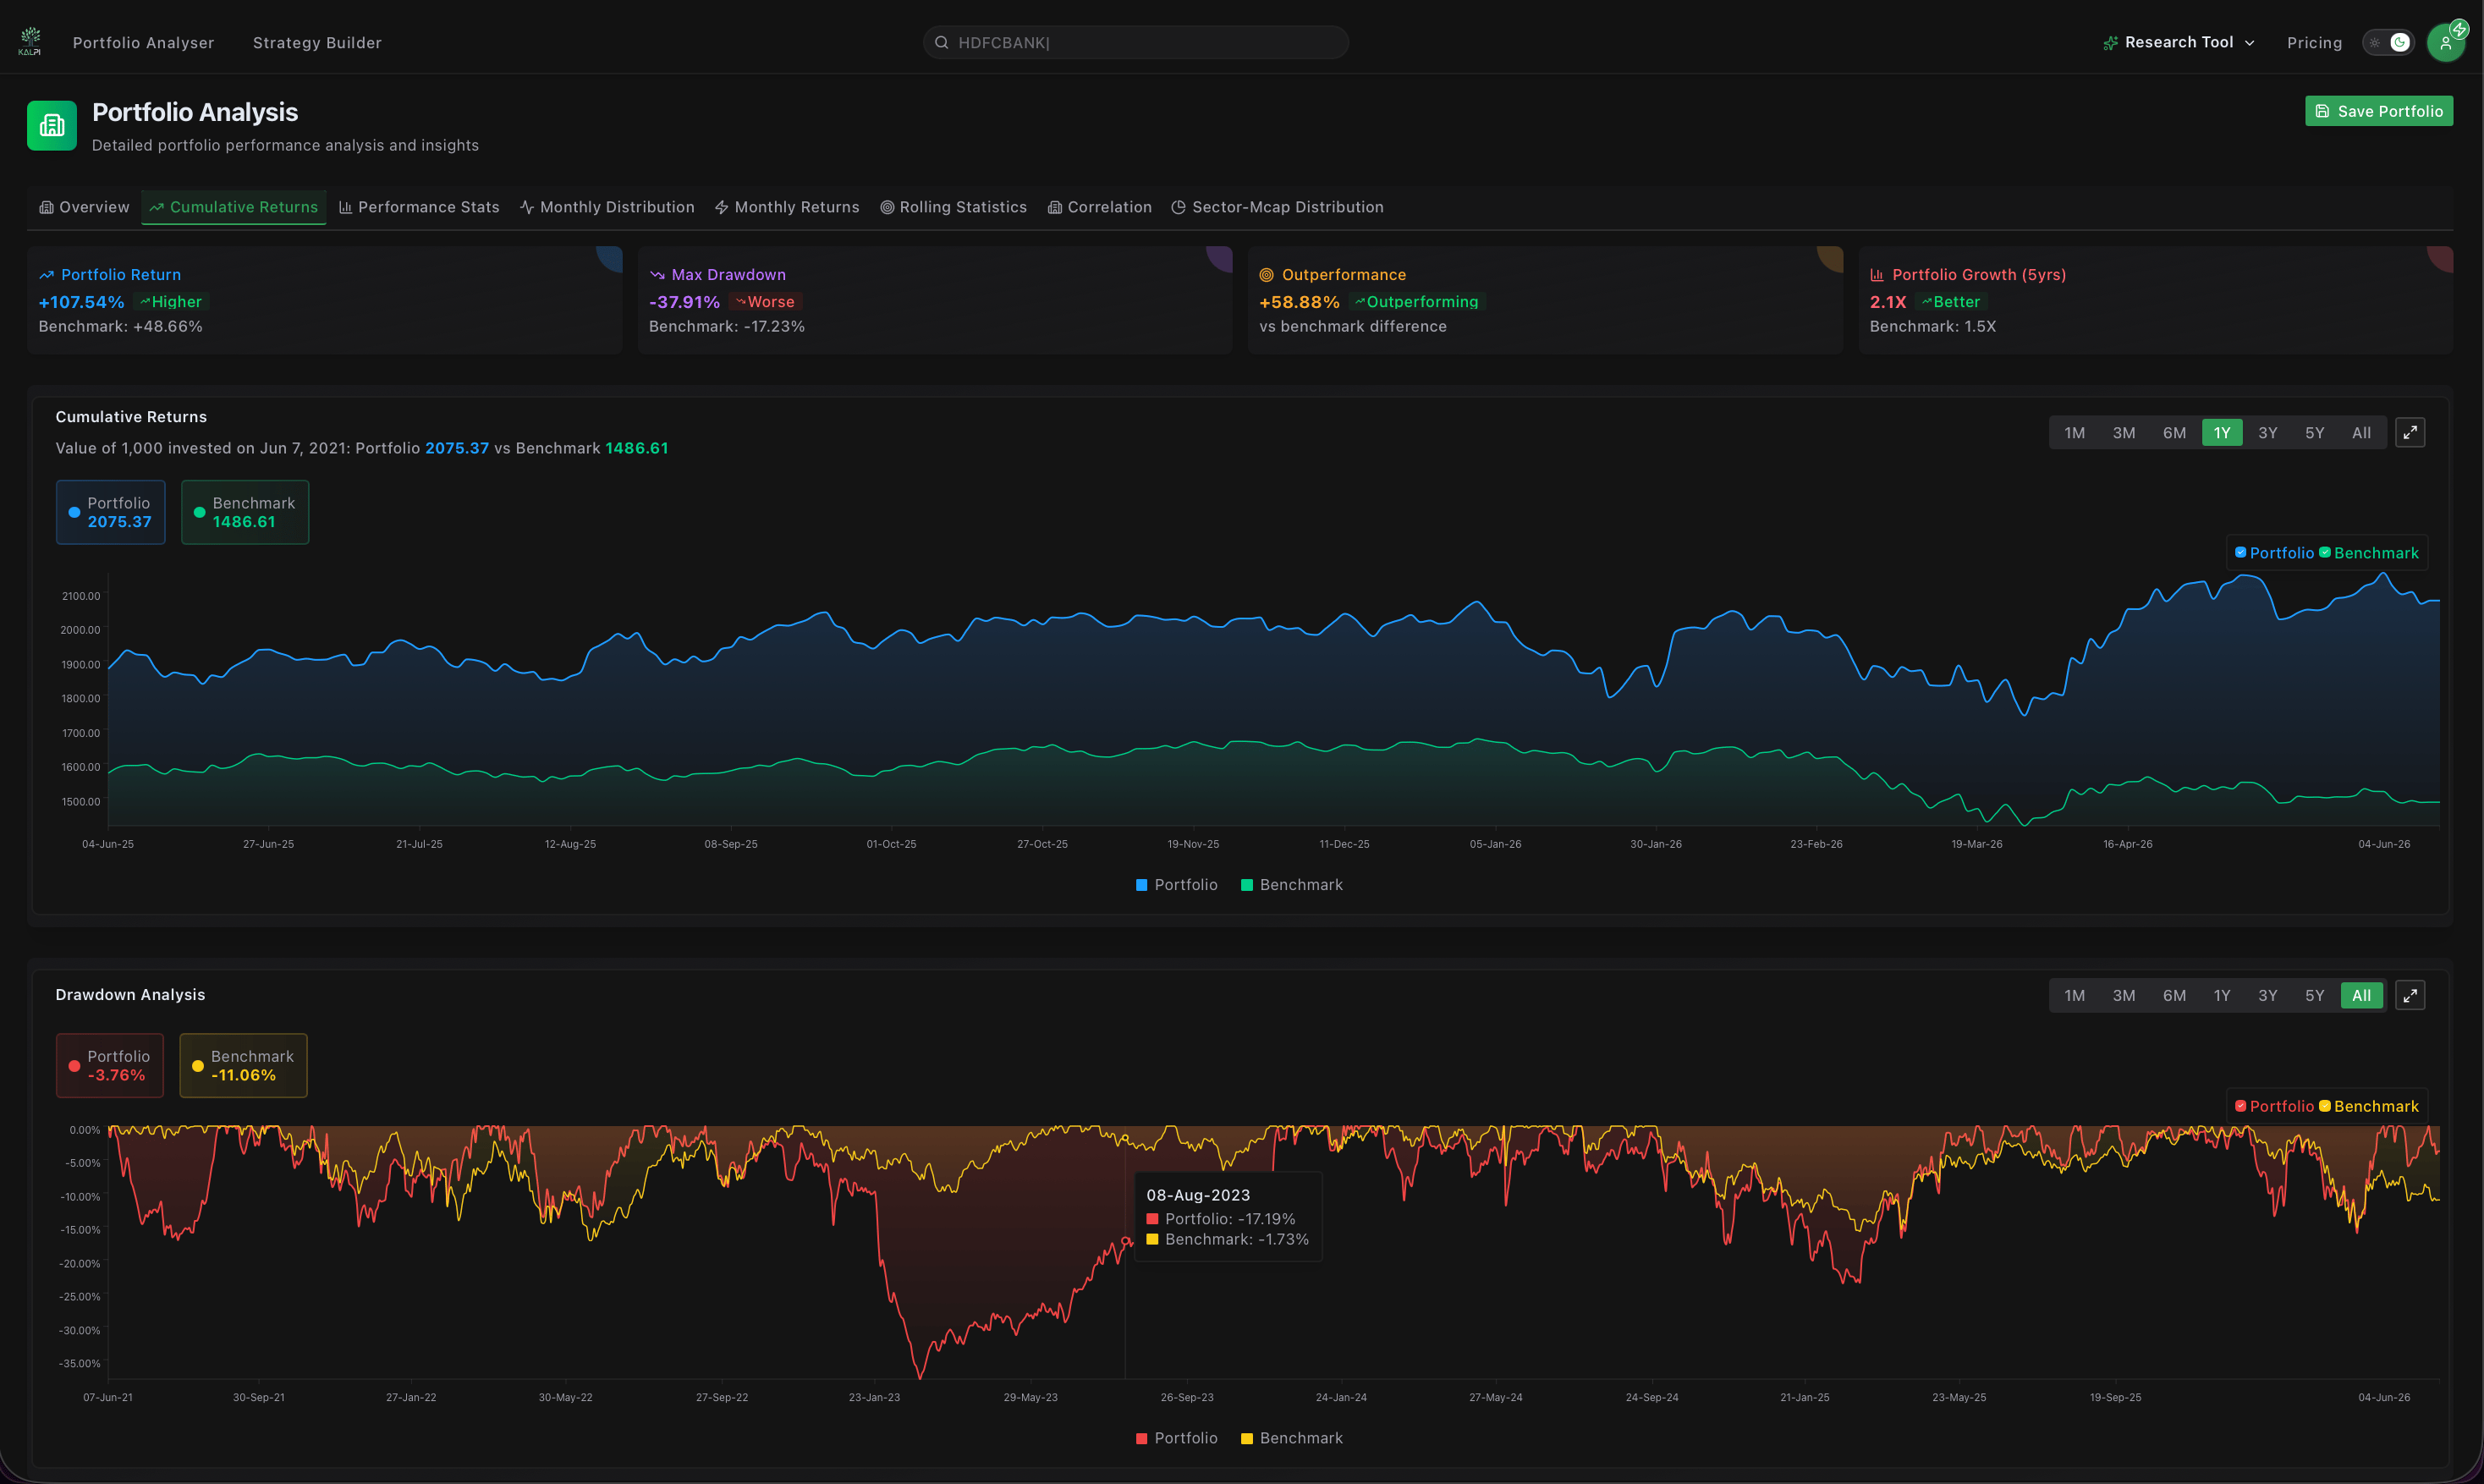
- Cumulative Returns & Drawdowns
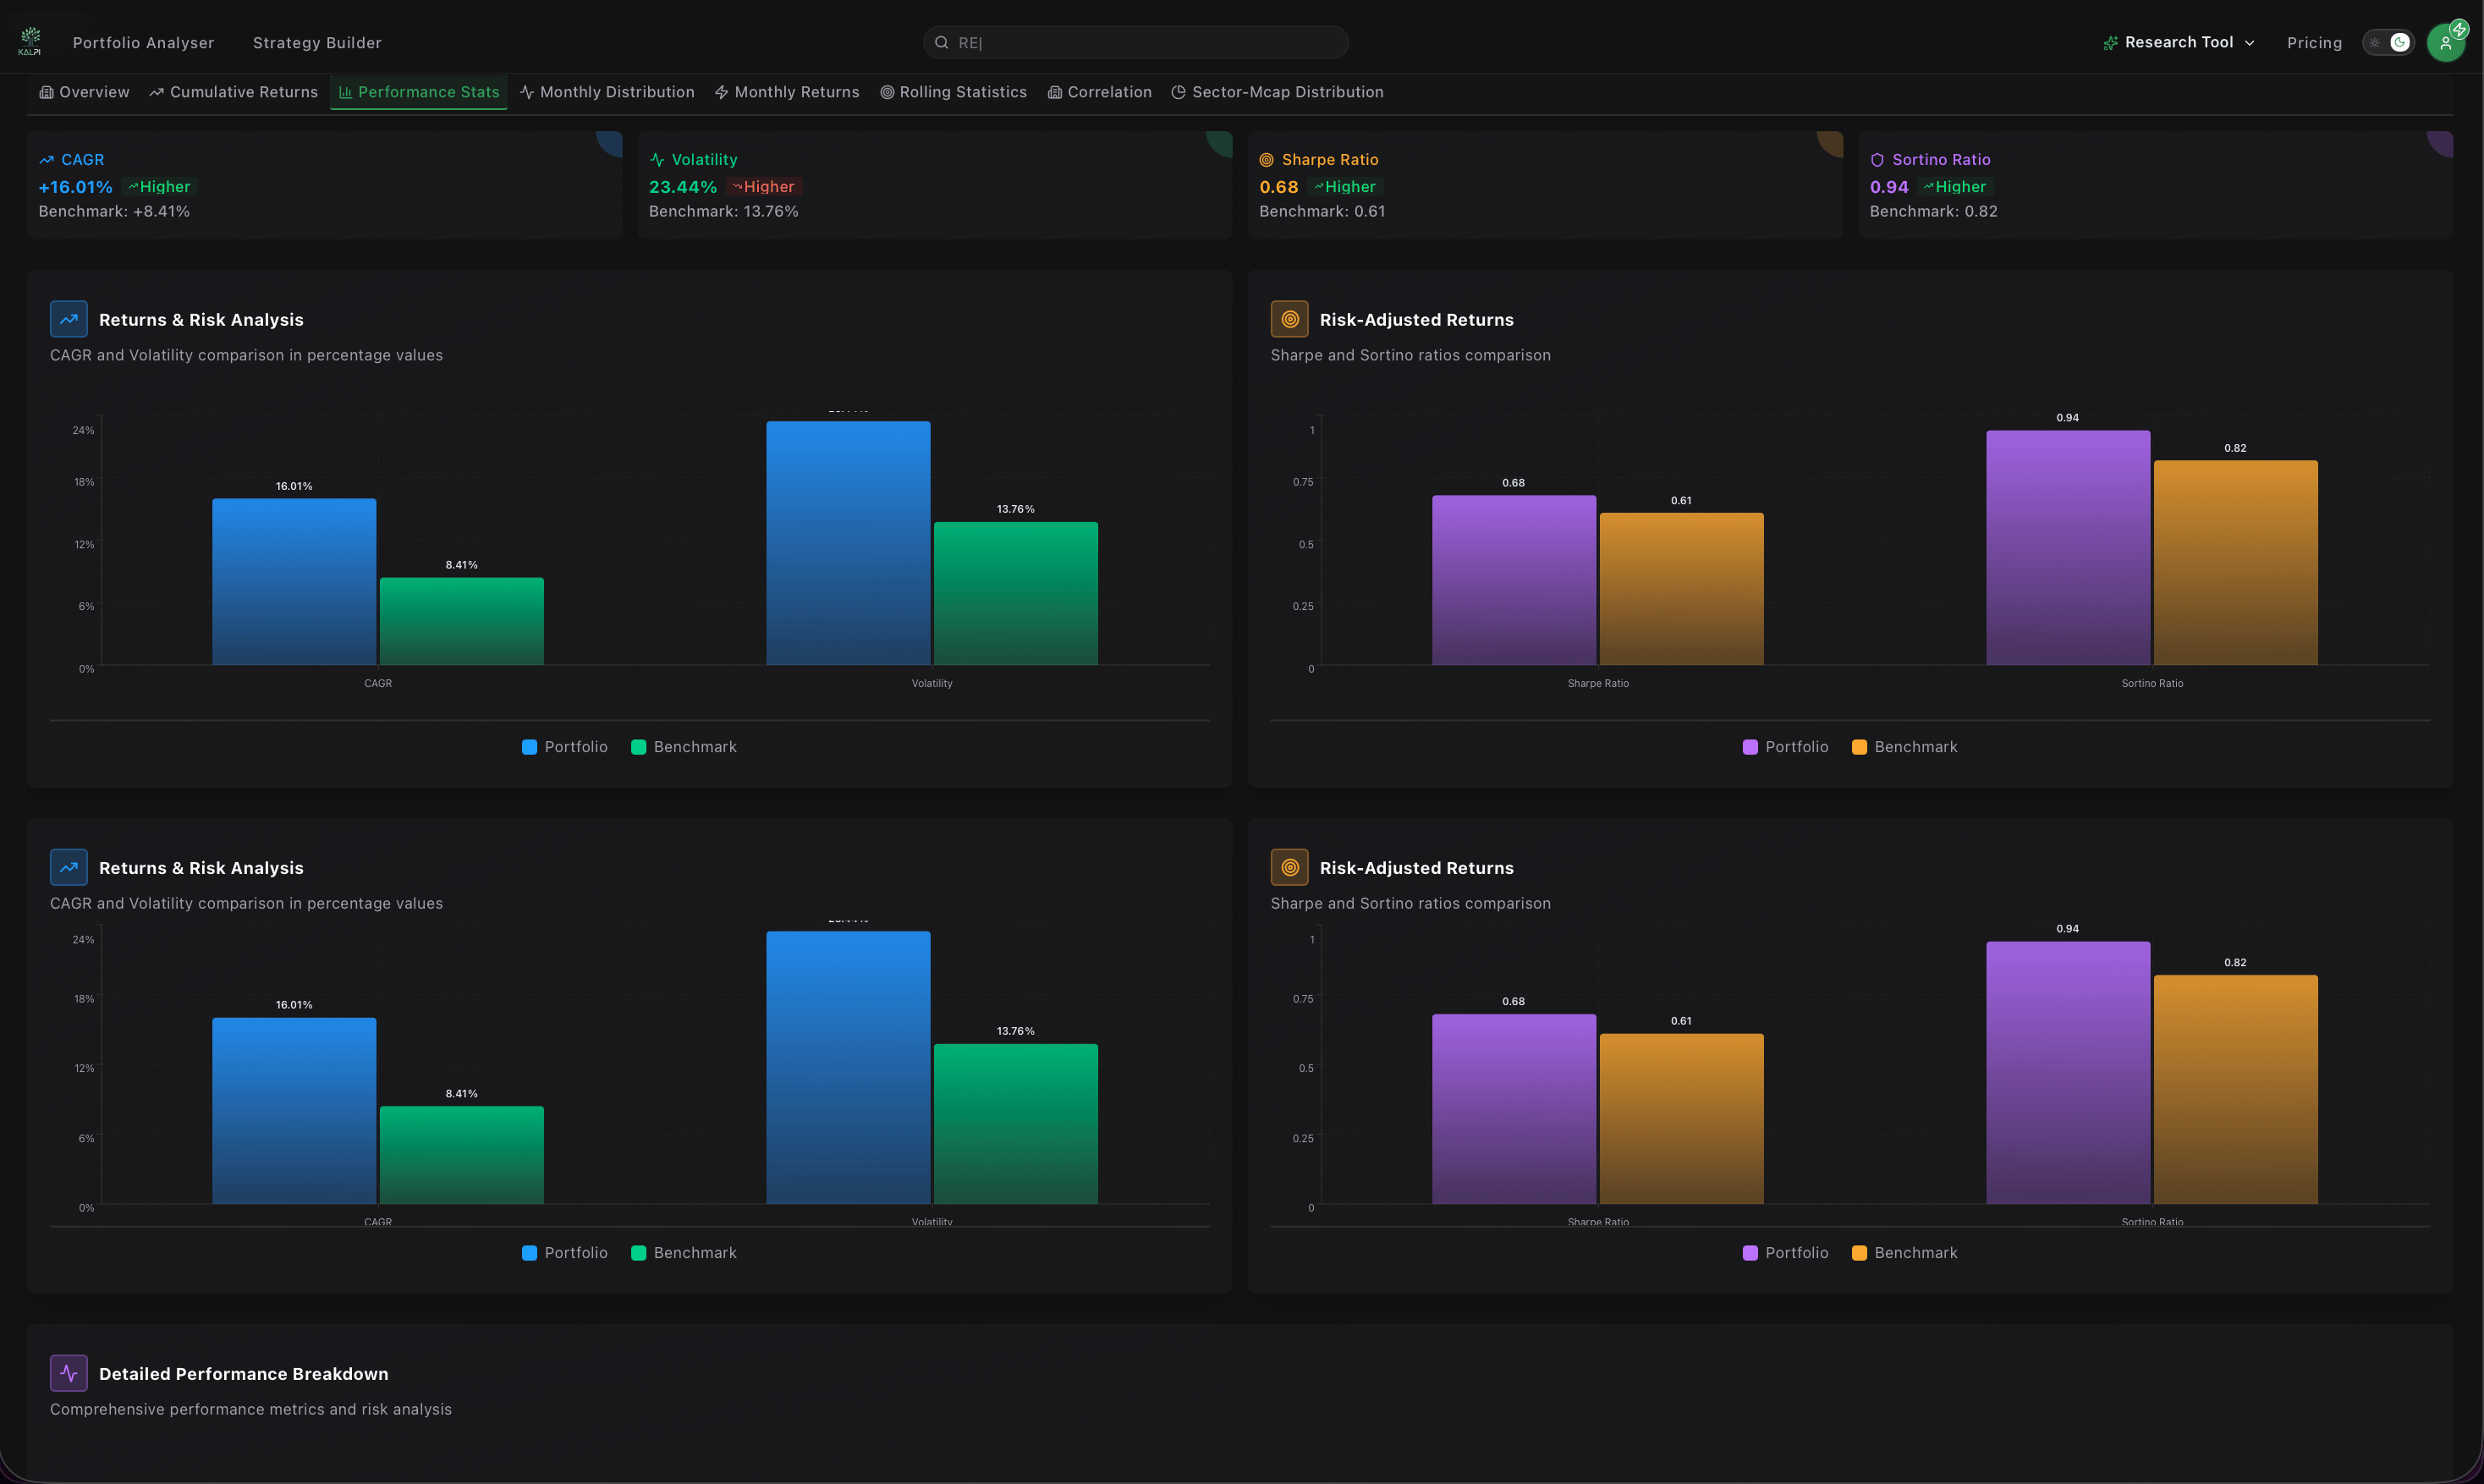
- Risk-Adjusted Performance Statistics
- Monthly Returns & Distribution Histograms
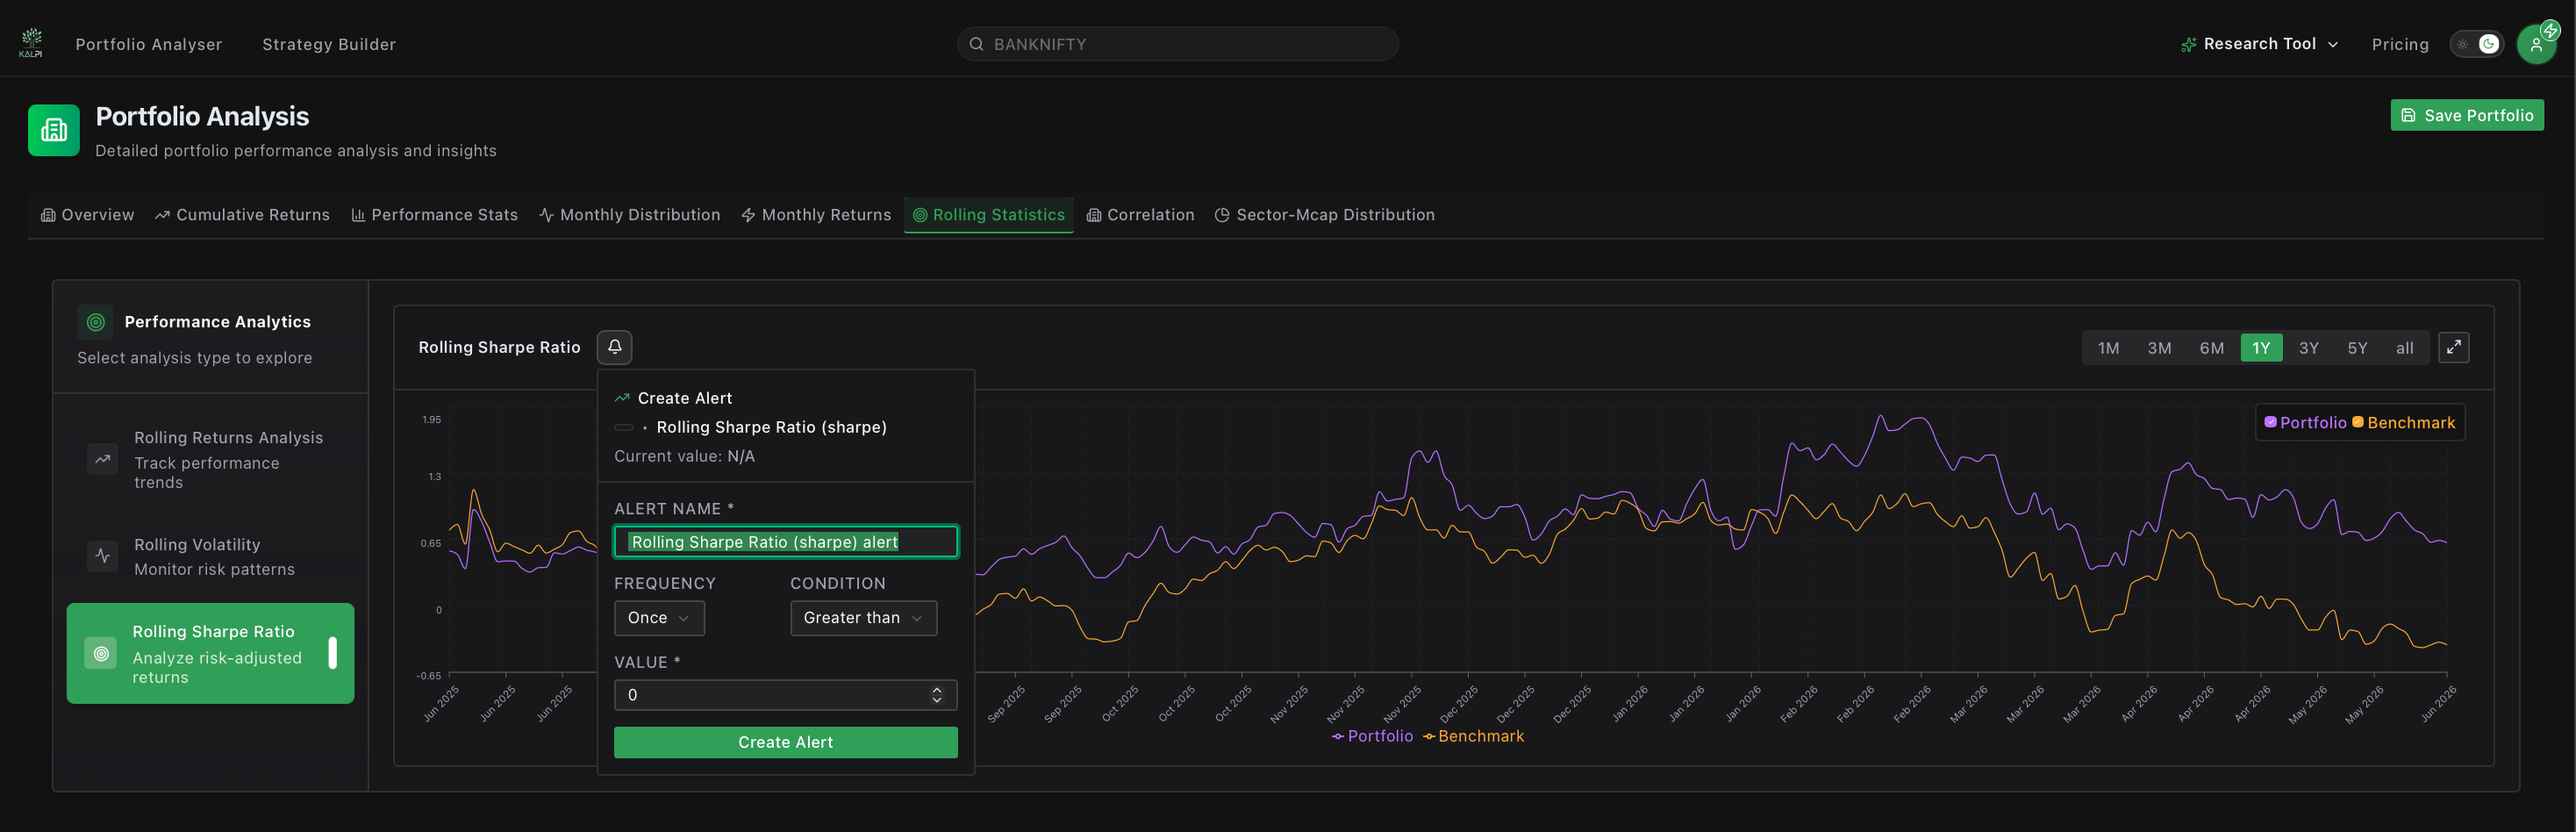
- Rolling Statistics & Correlations
- Sector & Market Cap Breakdown
Provides a high-level summary of your portfolio’s underlying core fundamental metrics and capital distributions.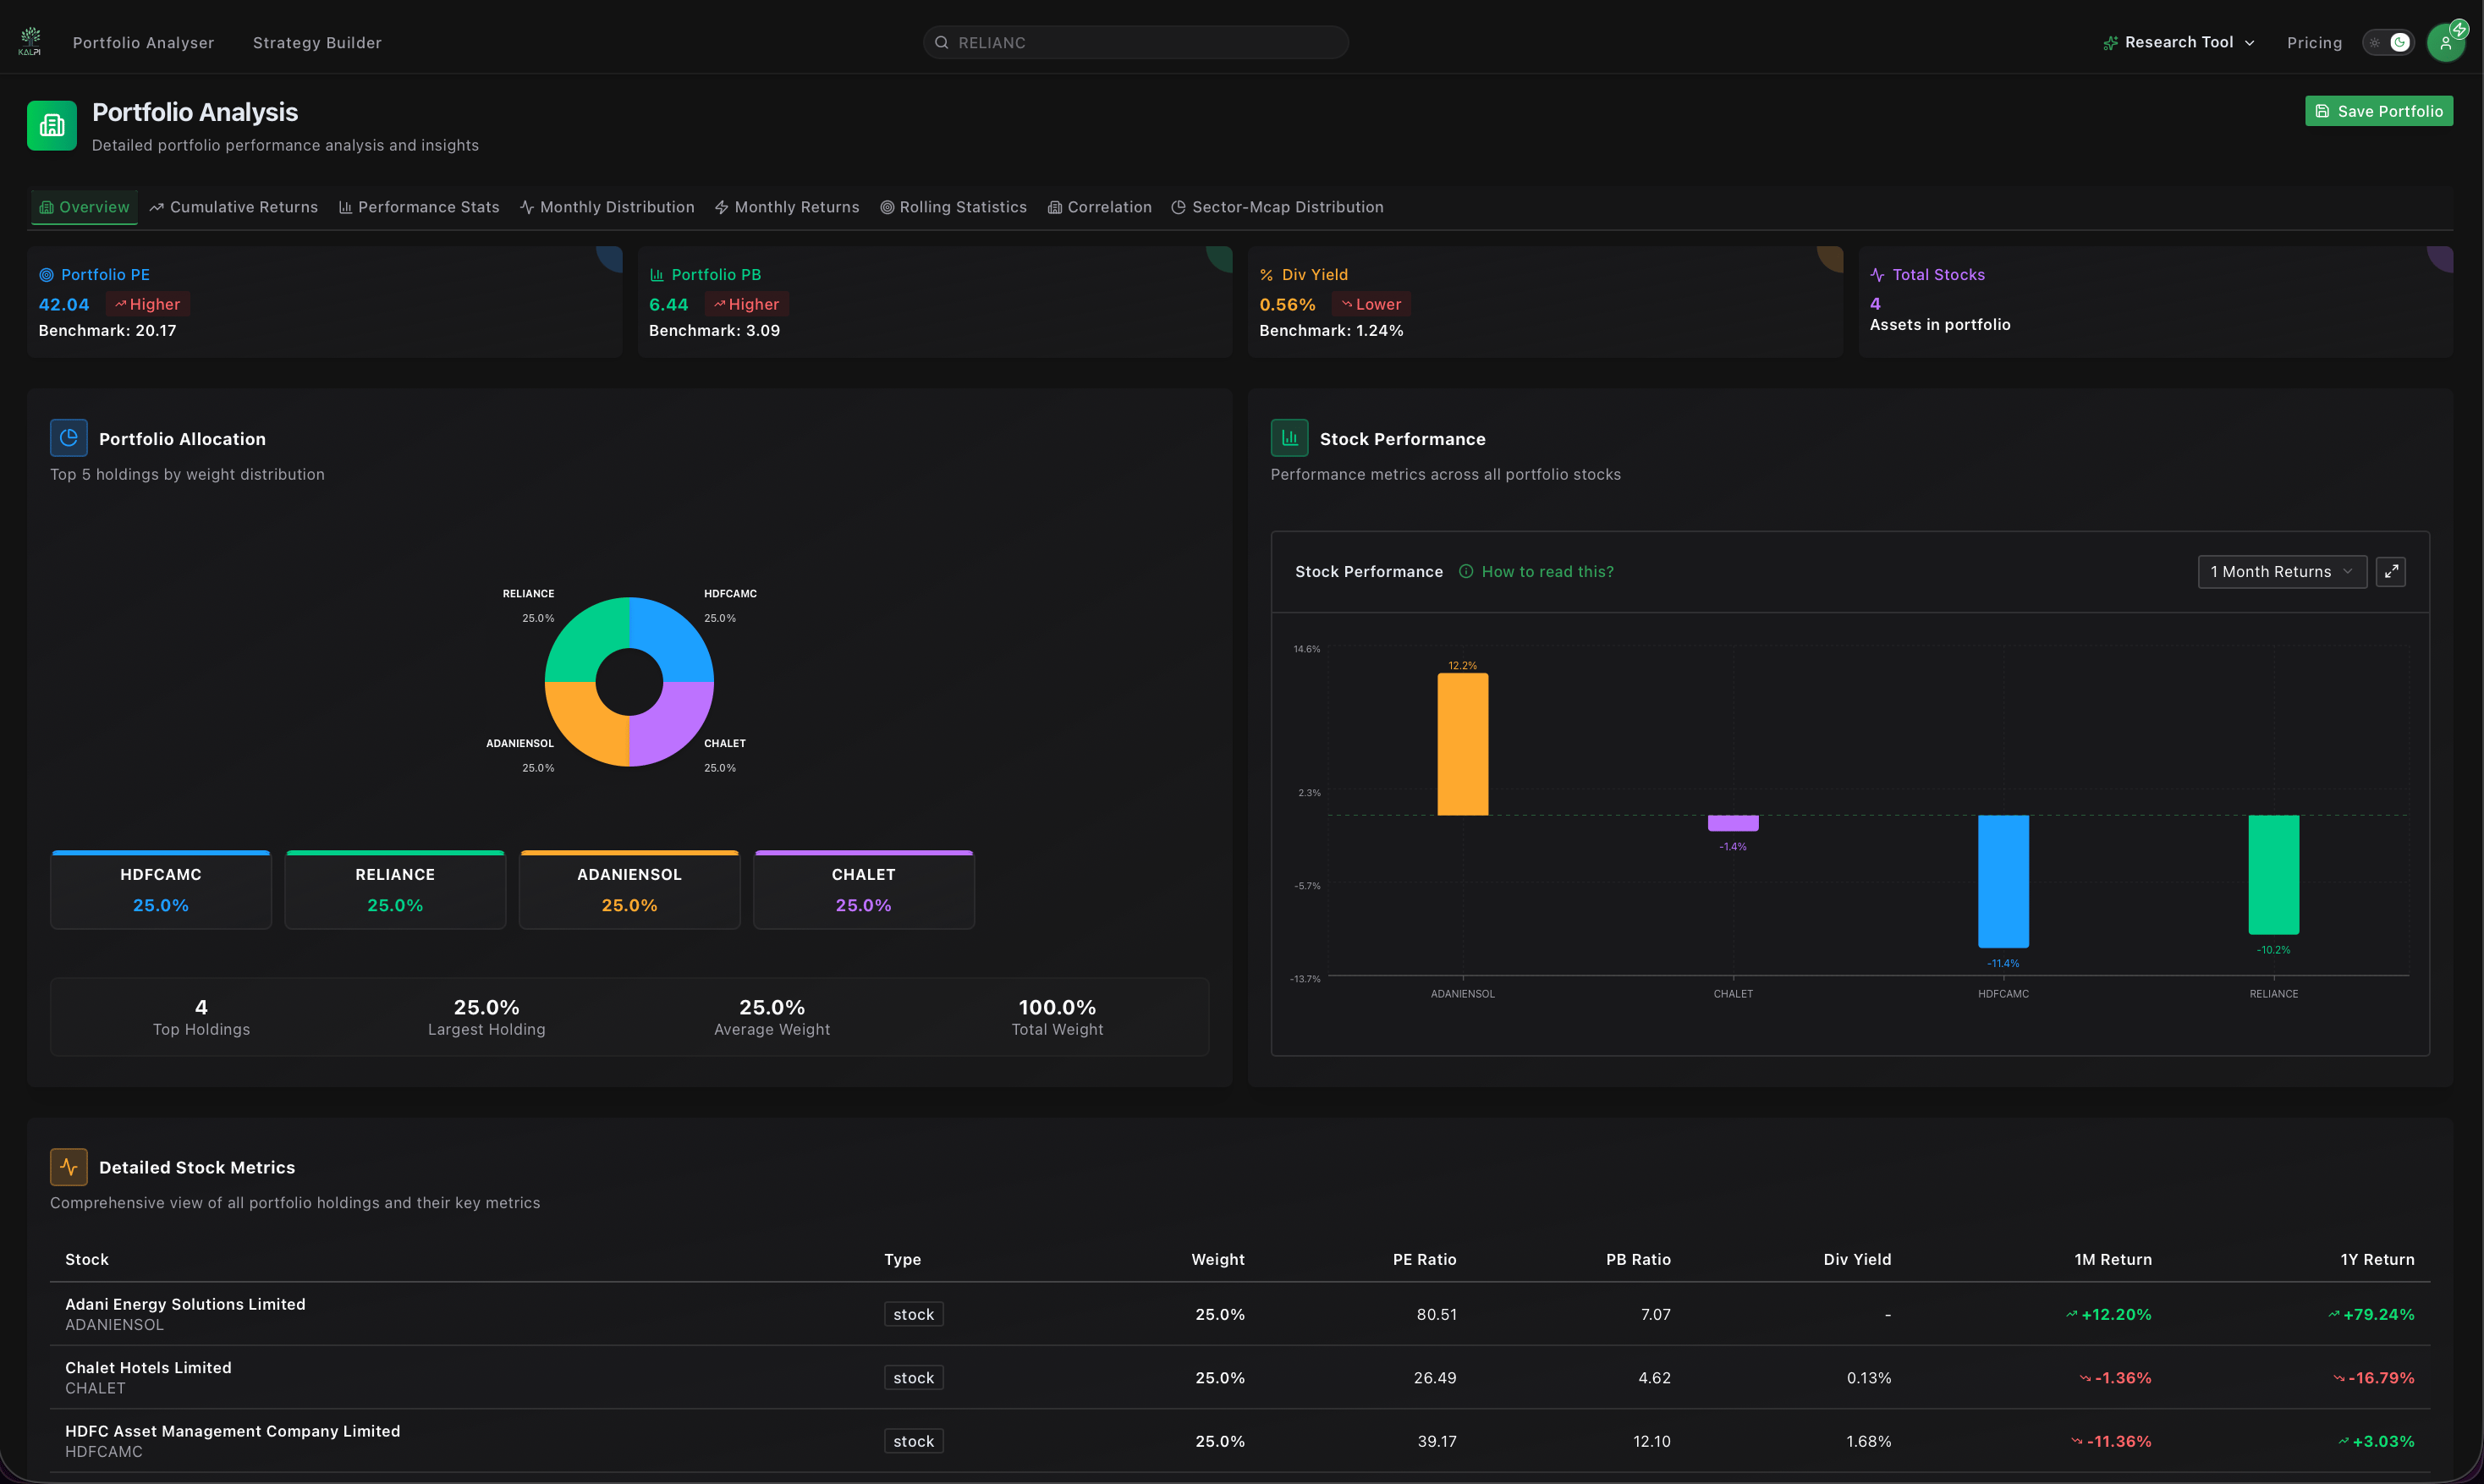
Core Variables Tracked:
- Portfolio PE & PB: Integrated fundamental valuations measured directly against the benchmark’s multiple limits.
- Dividend Yield: Aggregate cash-flow yield derived from your specific asset allocation.
- Visual Alignment: Interactive portfolio pie charts map your current holding concentrations alongside individualized stock performance return profiles.