
Analysis Modes
Using the toggle at the top right of the dashboard, you can seamlessly switch between two distinct research modes depending on your analytical needs.- Single Analysis: Deep-dive into the historical seasonal trends of a single asset using the top search bar.
- Compare Symbols: Open a side-by-side split screen to compare the seasonal patterns of two different assets (e.g., NIFTY vs. HDFC Bank) simultaneously.
Interpreting the Charts
The dashboard breaks down seasonality into two complementary charts that work together to give you a complete picture of an asset’s historical character.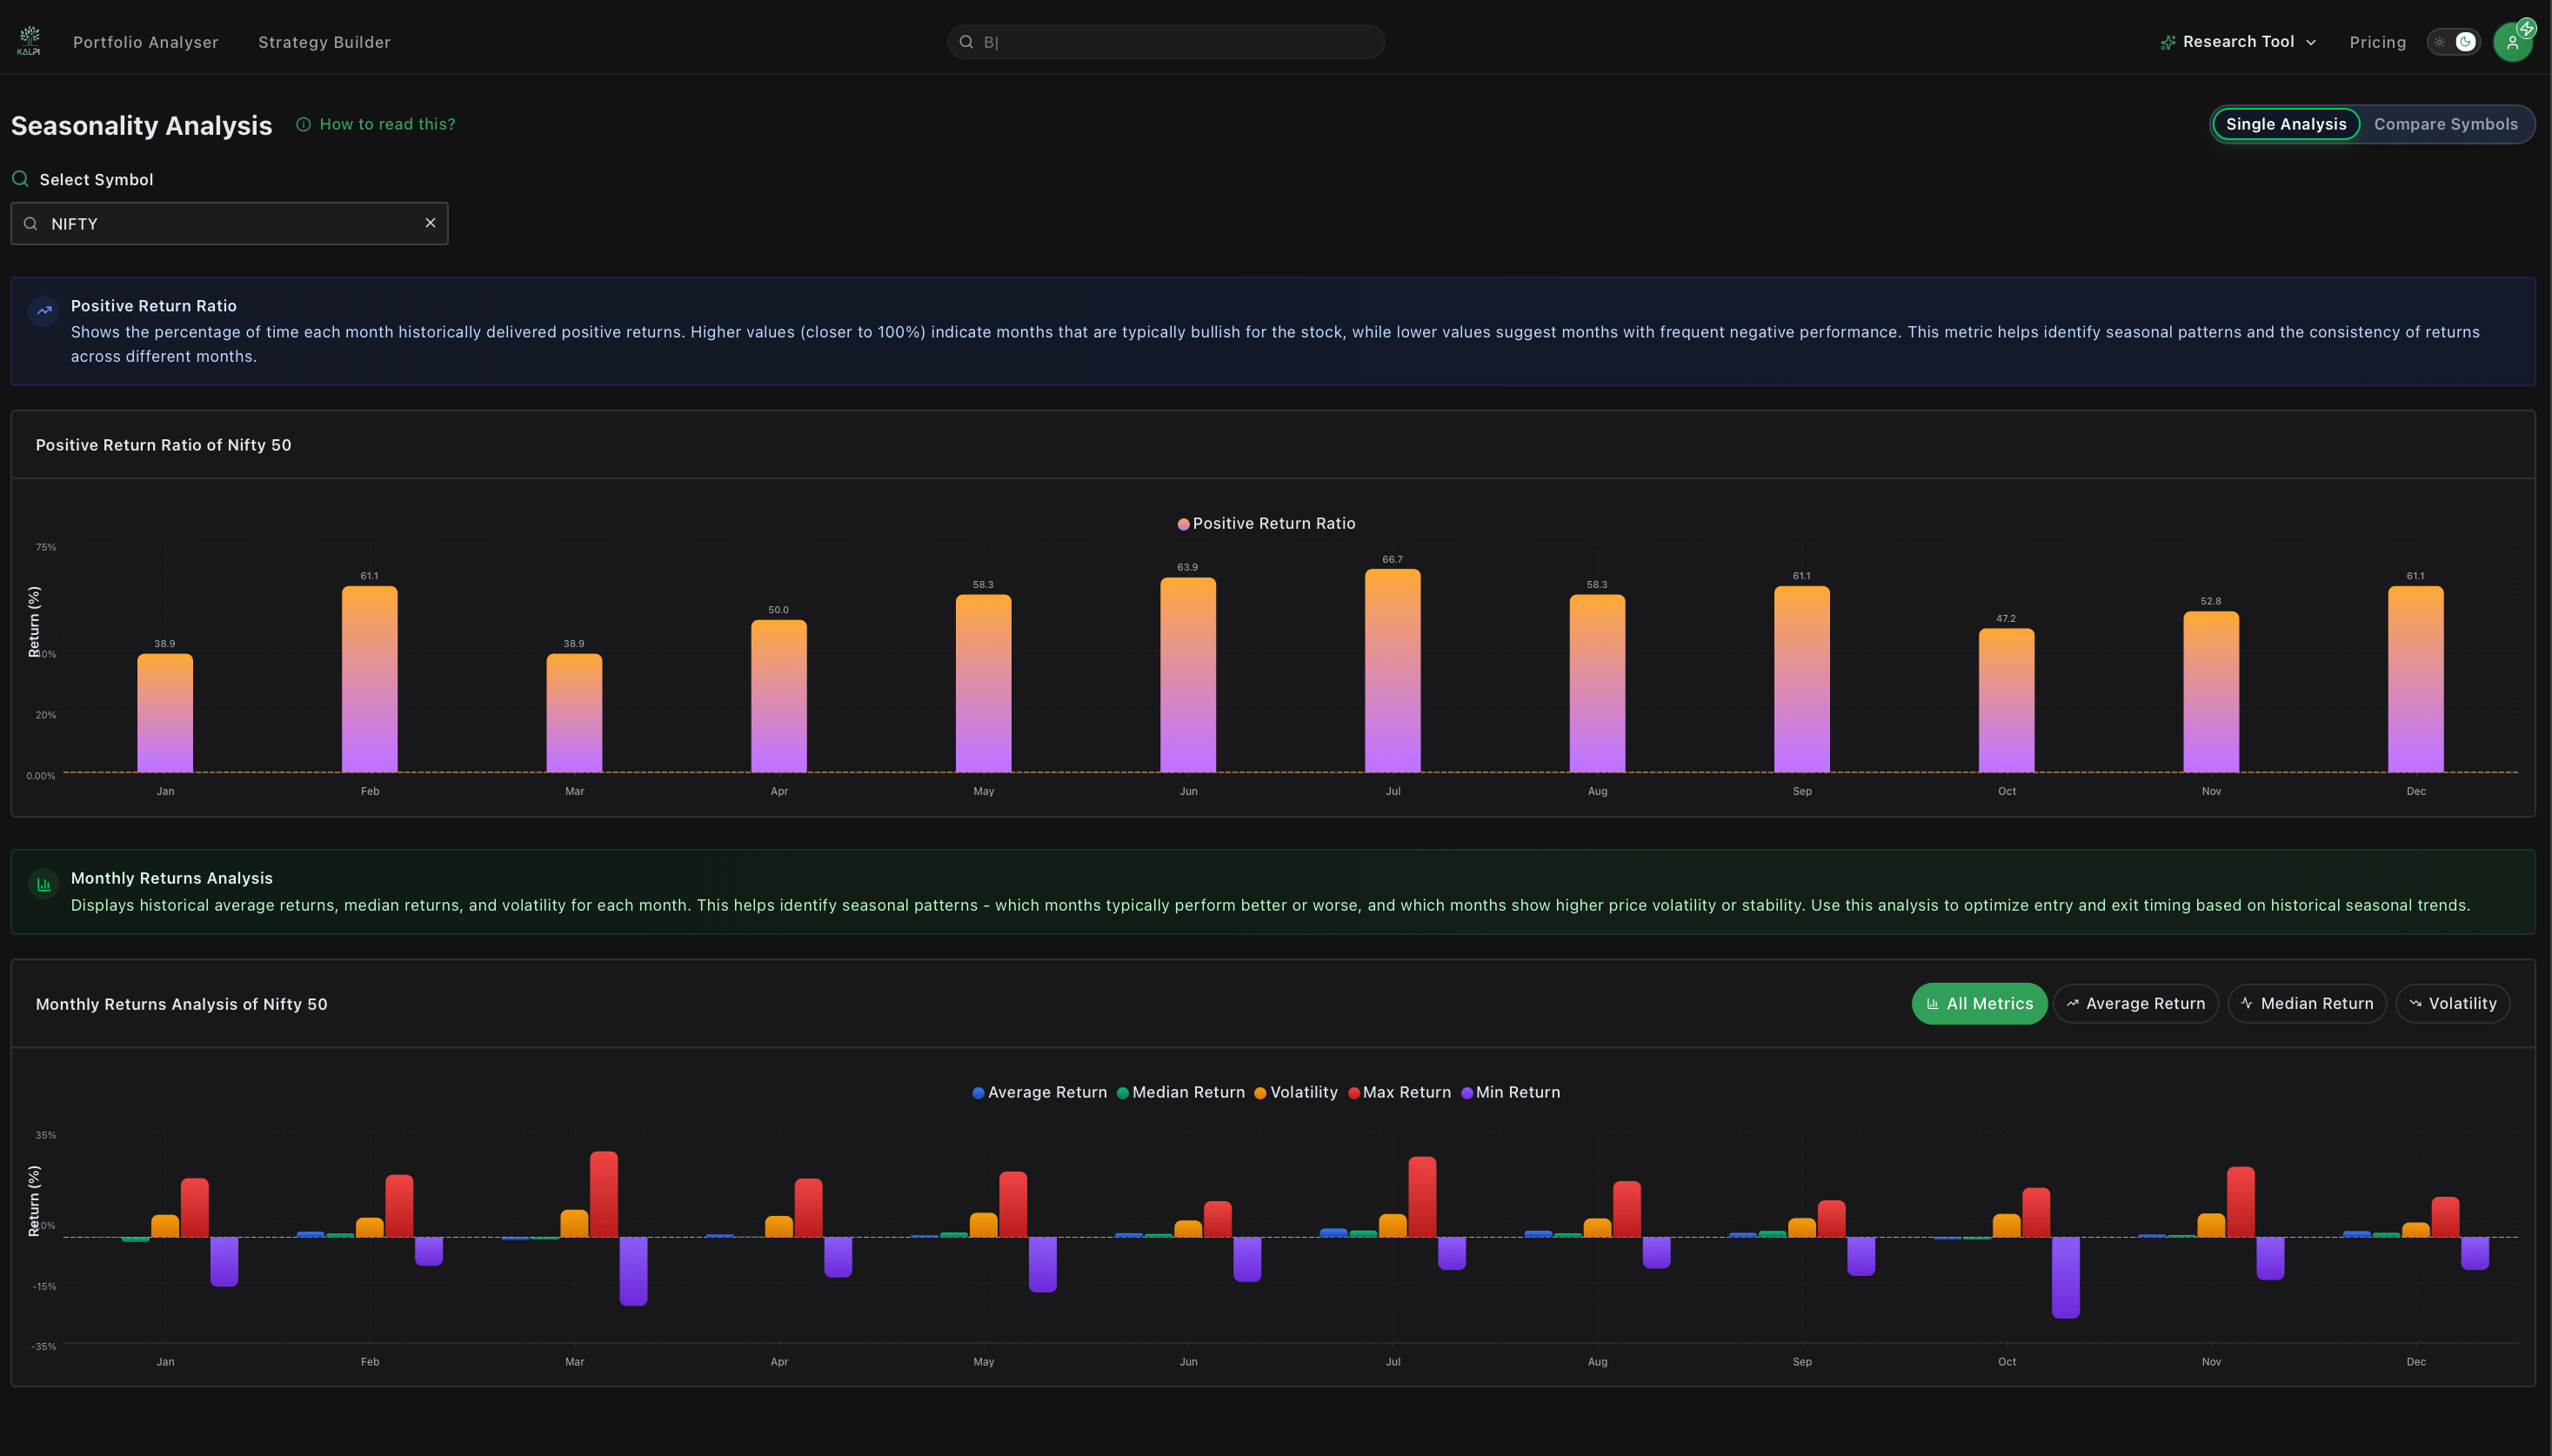
1. Positive Return Ratio
This chart answers the question: “How often is this month profitable?” It displays a clean bar chart showing the percentage of time each month historically delivered a positive return over the available history.- A high bar (e.g., 68%) indicates a month that is historically reliable and consistent in generating positive returns.
- A low bar suggests a month with frequent negative performance and a lower probability of finishing in the green.
2. Monthly Returns Analysis
This chart answers the question: “When this month is profitable (or not), by how much? And what is the risk?” Located directly below the ratio chart, this section provides a deeper look into the magnitude of those returns. You can click the filter buttons at the top of the chart to isolate specific metrics:- Average & Median Return: Track the baseline historical gain or loss expected for that month.
- Max & Min Return: View the single best and single worst performance ever recorded for that month to understand maximum potential upside and downside.
- Volatility: Isolate this metric to see how wide the price swings have historically been. Higher volatility means wider price ranges and more systemic risk.
Actionable Insights (Built-In Guide)
If you need a quick refresher on how to apply seasonality data to your trading, click the green “How to read this?” button next to the page title. This opens a detailed side drawer containing strategic insights, such as:- Identifying High-Probability Setups: Looking for months that feature both a high Positive Return Ratio (>60%) and a healthy positive Average Return.
- Assessing the True Risk: Avoiding “boom or bust” months where a high average return is skewed by massive historical volatility or extreme drawdowns.
- Strategic Timing: Tightening stop-losses or sizing down positions as you approach historically weak or volatile months.