
Navigating the Dashboard
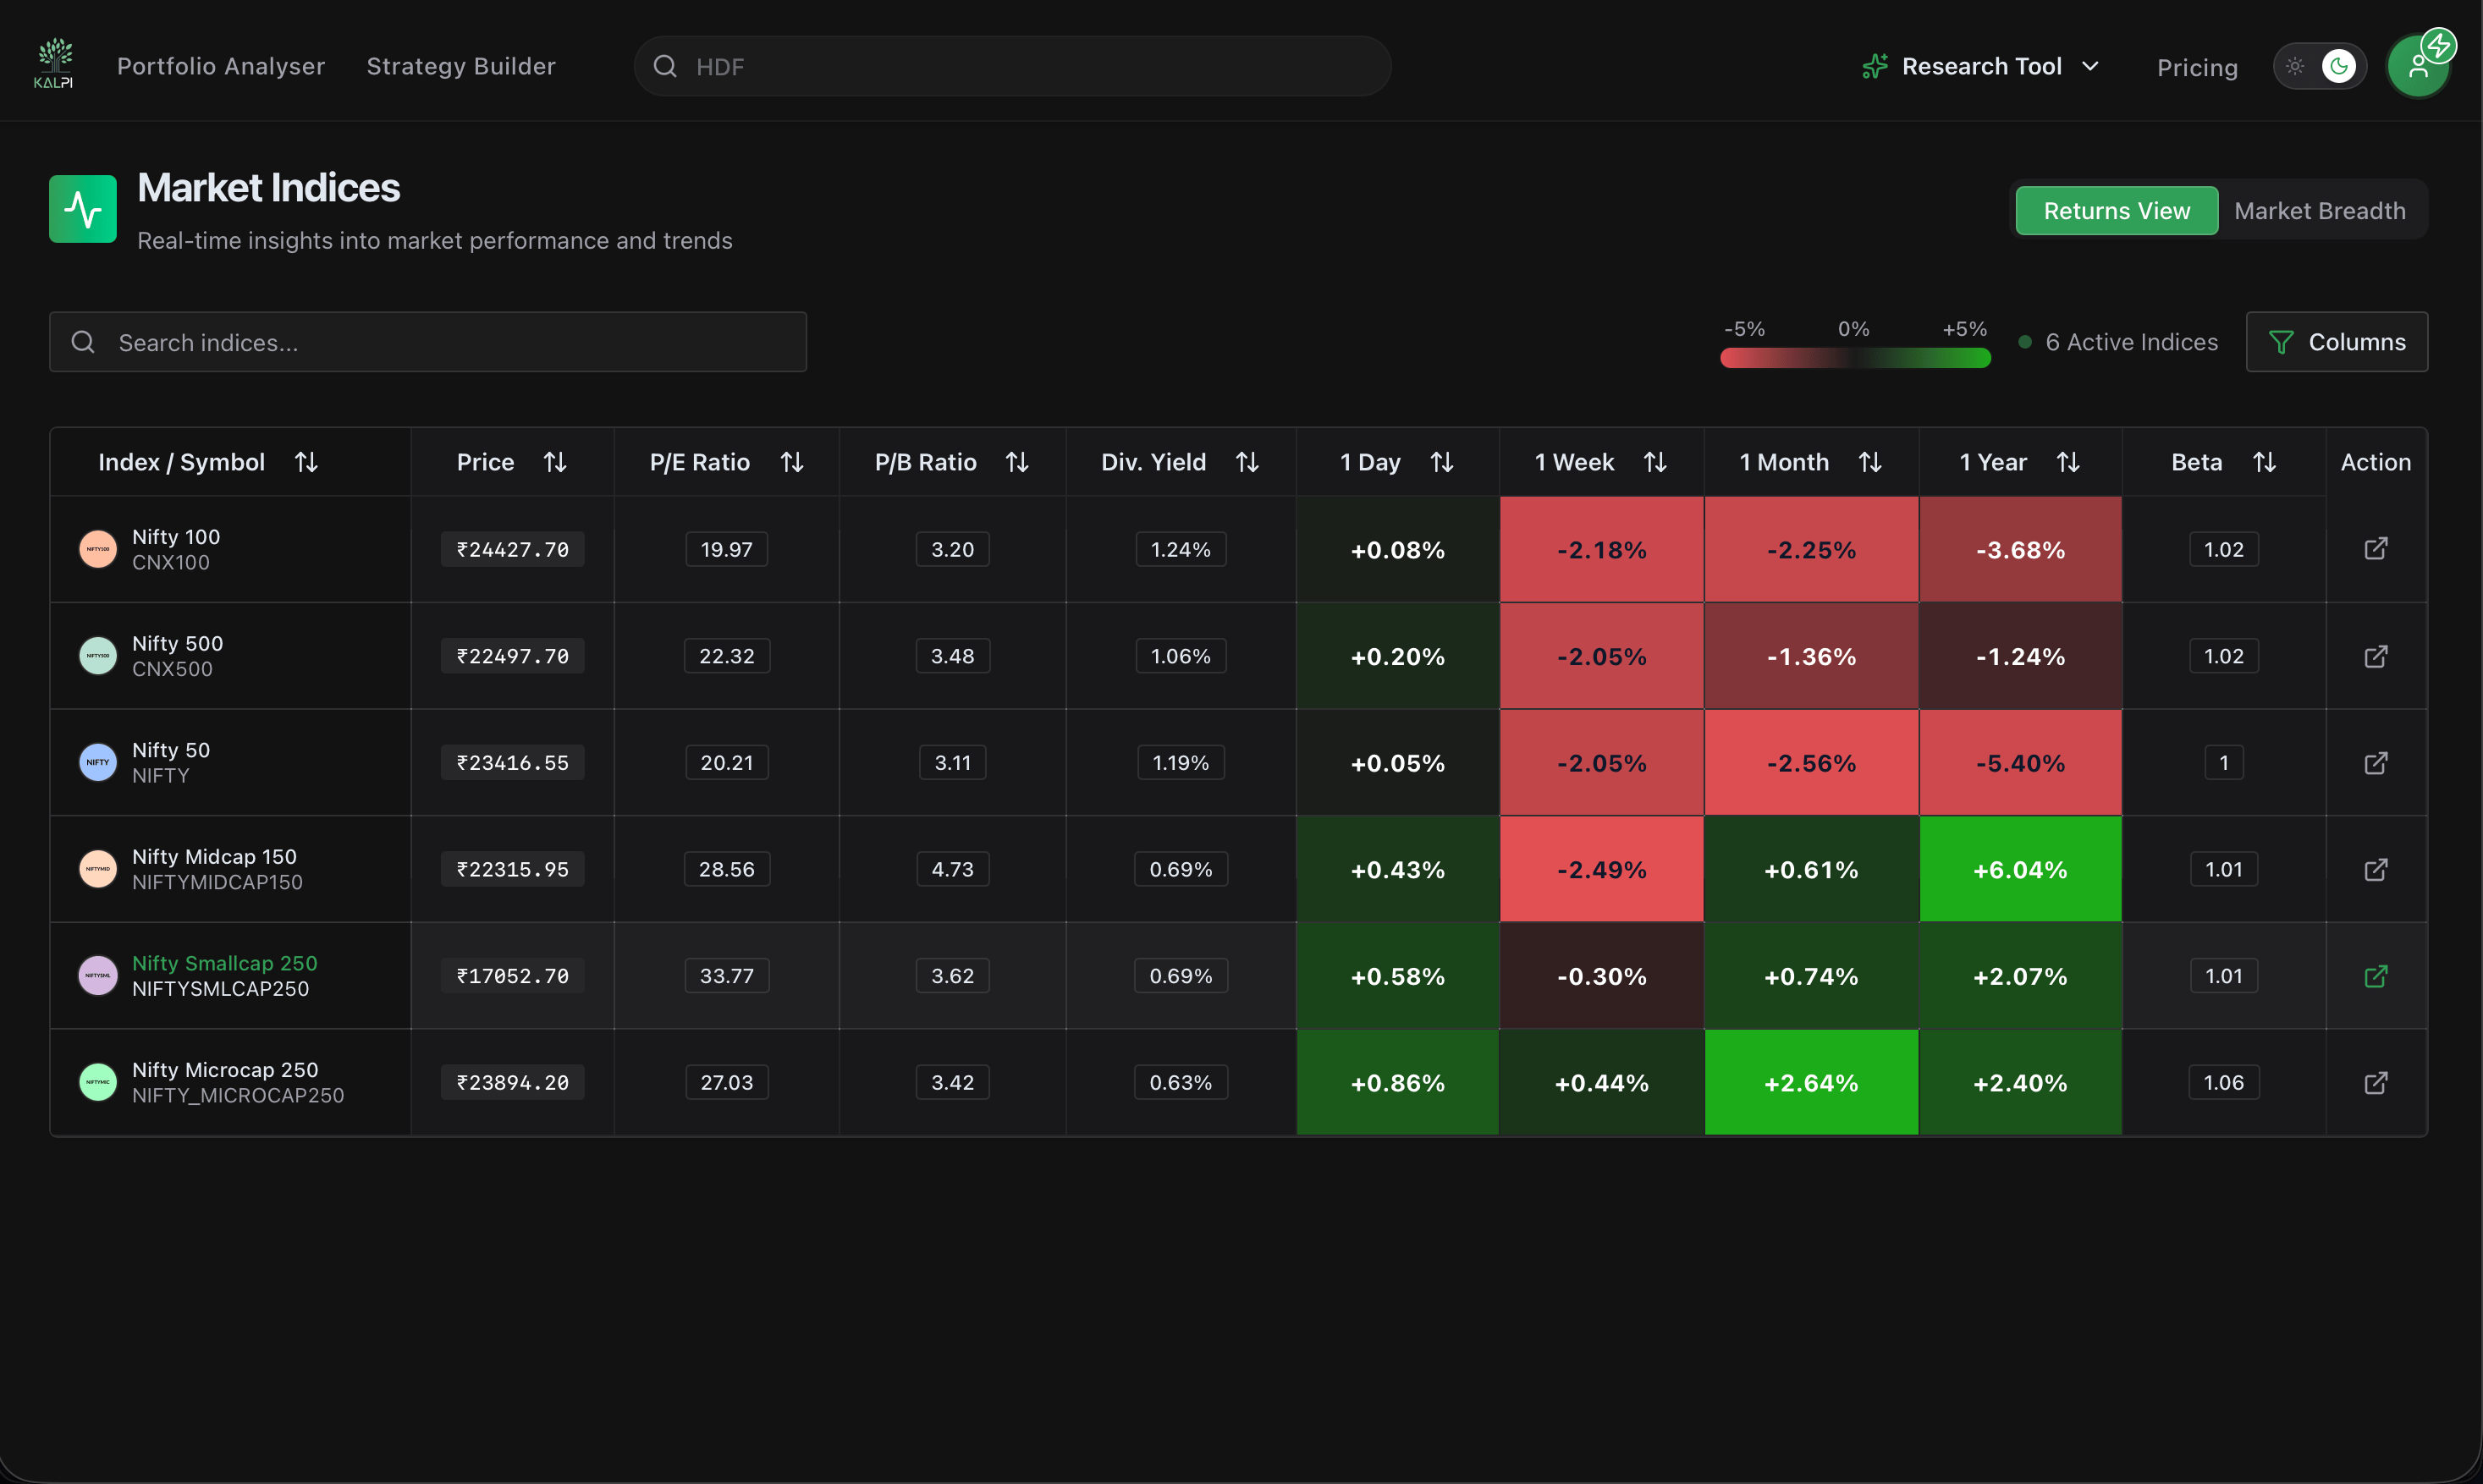
The dashboard is split into two primary analytical views, which you can toggle using the buttons at the top right of the table: Returns View and Market Breadth.1. Returns View (Default)
This view provides a fundamental and technical snapshot of major indices like the Nifty 50, Nifty Bank, and Nifty Midcap 150.- Core Valuations: Monitor index-level fundamental health with real-time columns for P/E Ratio, P/B Ratio, and Div. Yield.
- Momentum & Performance: Spot trend shifts instantly with color-coded performance blocks tracking 1 Day, 1 Week, 1 Month, and 1 Year returns.
- Systemic Risk (Beta): Evaluate comparative market volatility.
- Custom Columns: Click the Columns filter at the top right to cleanly toggle specific data points on or off to suit your screen size and focus.
2. Market Breadth View
Switching to the Market Breadth tab allows you to look under the hood of the indices to see the internal participation driving the price action.- Moving Average Strength: Track exactly how many constituents are trading in an uptrend with columns for Above EMA 20, 50, 100, and 200.
- Daily Movers: Monitor extreme short-term momentum by seeing how many stocks are Up 4.5% Today versus Down 4.5% Today.
- 52-Week Proximity: Identify structural breakouts by tracking how many stocks are trading Near 52W High 5% or bottoming out near their 52-week lows.