
Interactive Feature Breakdown
Expand the sections below to explore each core module of the terminal, optimize its filtering system, and view its corresponding user interface layouts.1. Net Investment Trend Visualizer
1. Net Investment Trend Visualizer
The main chart visually overlays FII and DII footprints onto an aggregated Overall Net liquidity wave map, revealing critical shifts in market conviction.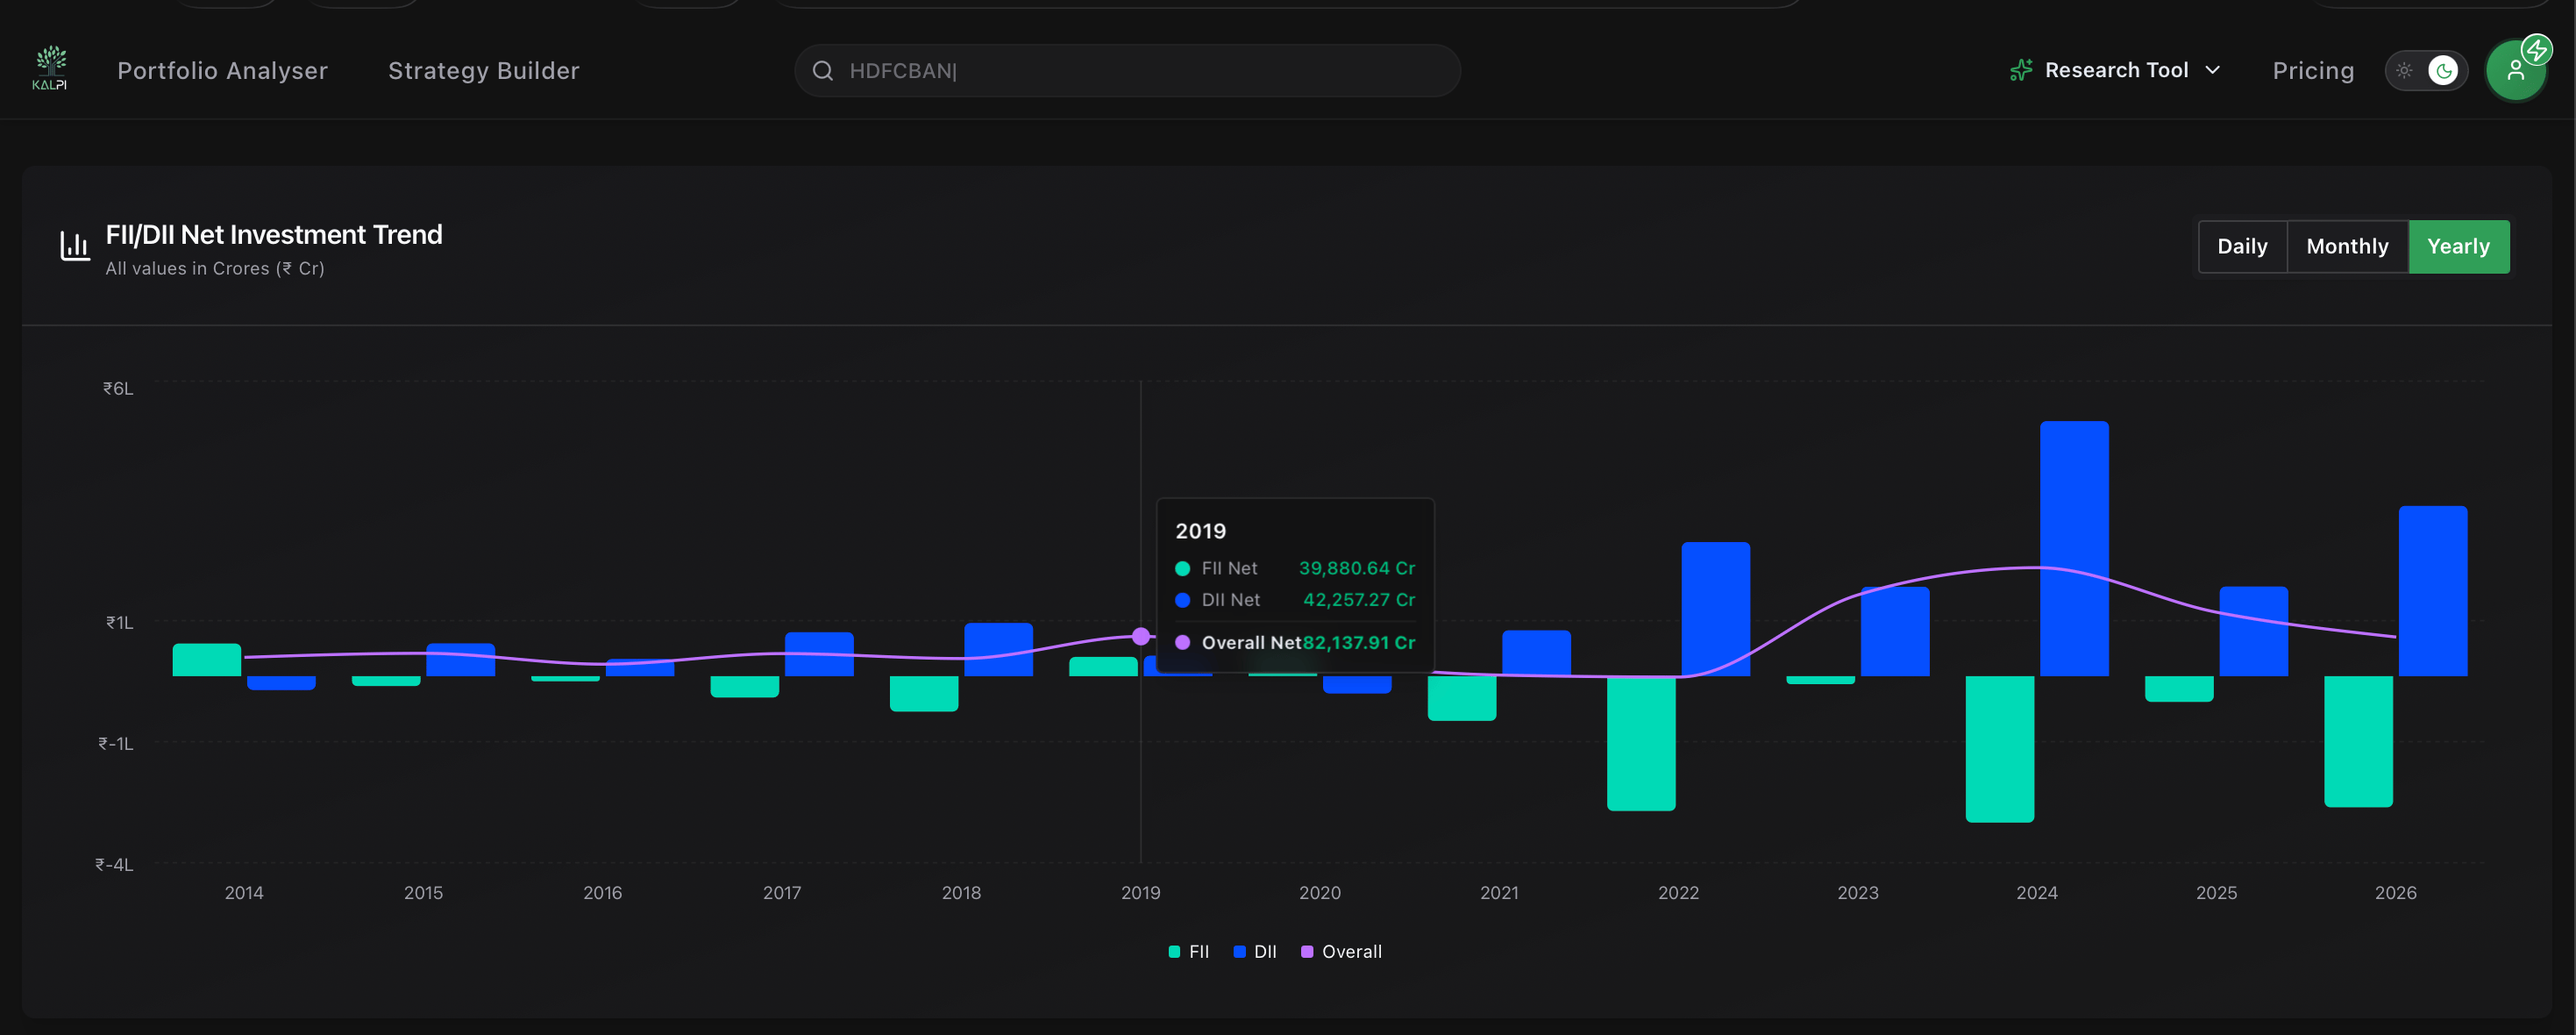
Core Mechanics:
- Granularity Multipliers: Click the Daily, Monthly, or Yearly buttons at the top right of the chart block to immediately change the time scale from day-to-day fluctuations to multi-year macroeconomic trends.
- Dynamic Window Dropdown: Filter your lookback view on the fly. Select predefined options like Recent 30 Days or scrub sequentially through historical months (e.g., Feb 2026) and full calendar years.
- Hover Tooltips: Hover your cursor over any bar on the graph to reveal precise data metrics detailing standalone FII, DII, and composite net monetary metrics tracked in Crores (₹ Cr).
2. Macro Flow Summary Blocks
2. Macro Flow Summary Blocks
Located directly below the primary chart, these three macro dashboards compile horizontal volume trackers to give you an immediate reading of liquidity across standard calendar scopes.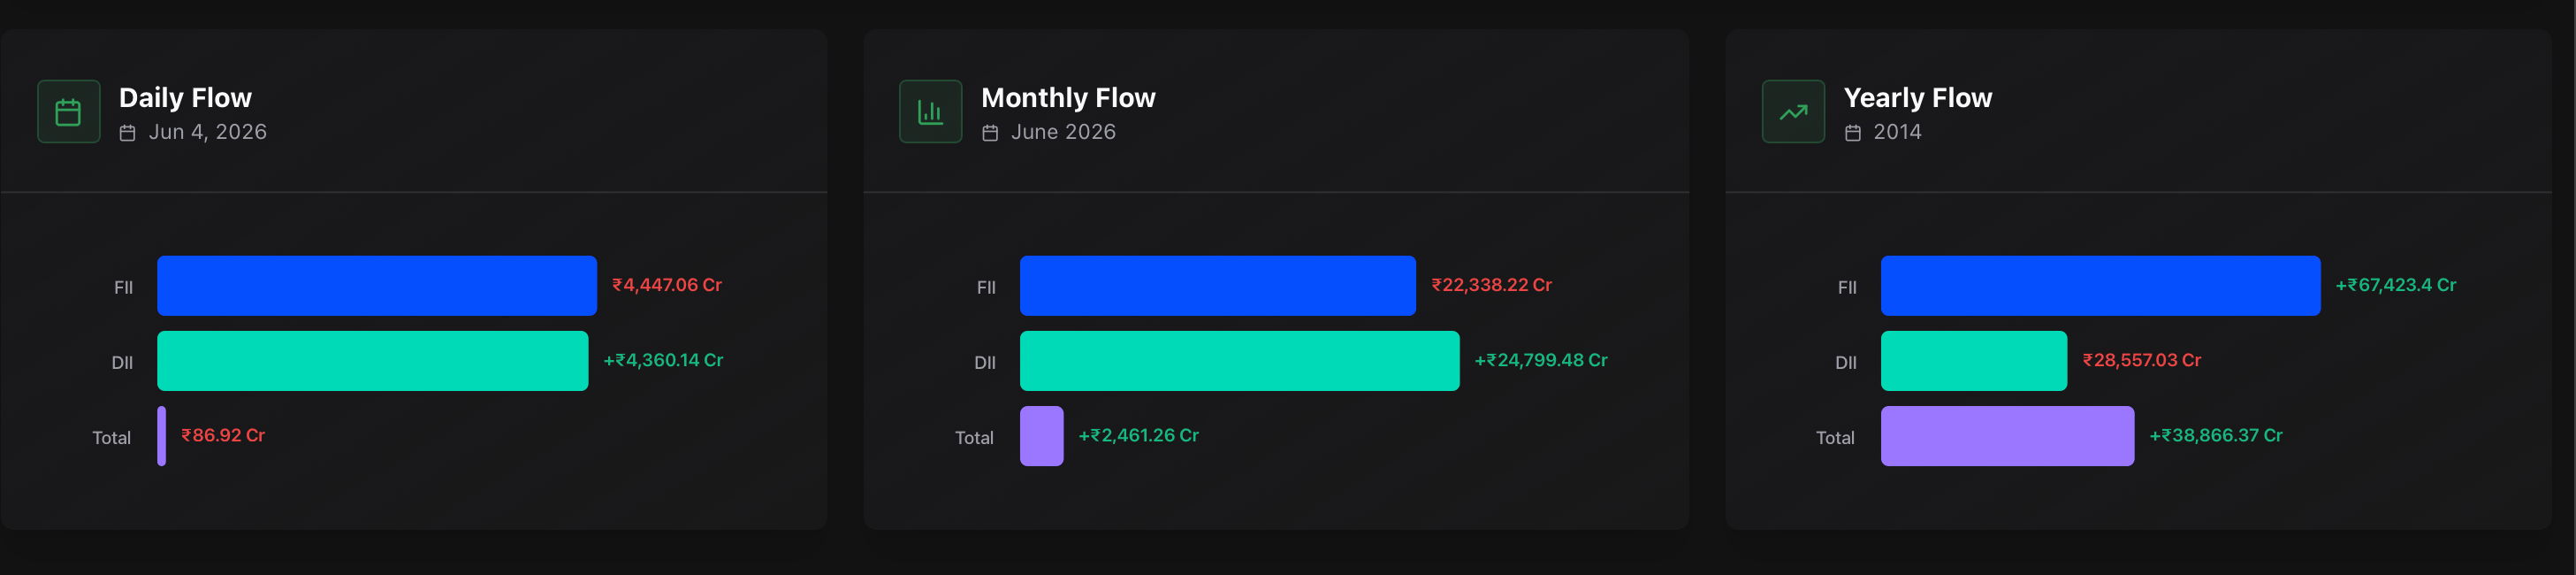
Core Mechanics:
- Daily Flow Card: Logs the explicit absolute breakdown of institutional operations for the most recently concluded market session.
- Monthly Flow Card: Tracks rolling month-to-date scale patterns to evaluate mid-term institutional momentum.
- Yearly Flow Card: Aggregates macro structural positioning to see which institutional class is driving the long-term secular market trend.
3. Detailed Audit Ledger Table
3. Detailed Audit Ledger Table
The terminal ends with a granular financial ledger database, designed for quantitative auditing and cross-referencing precise transactional pricing metrics.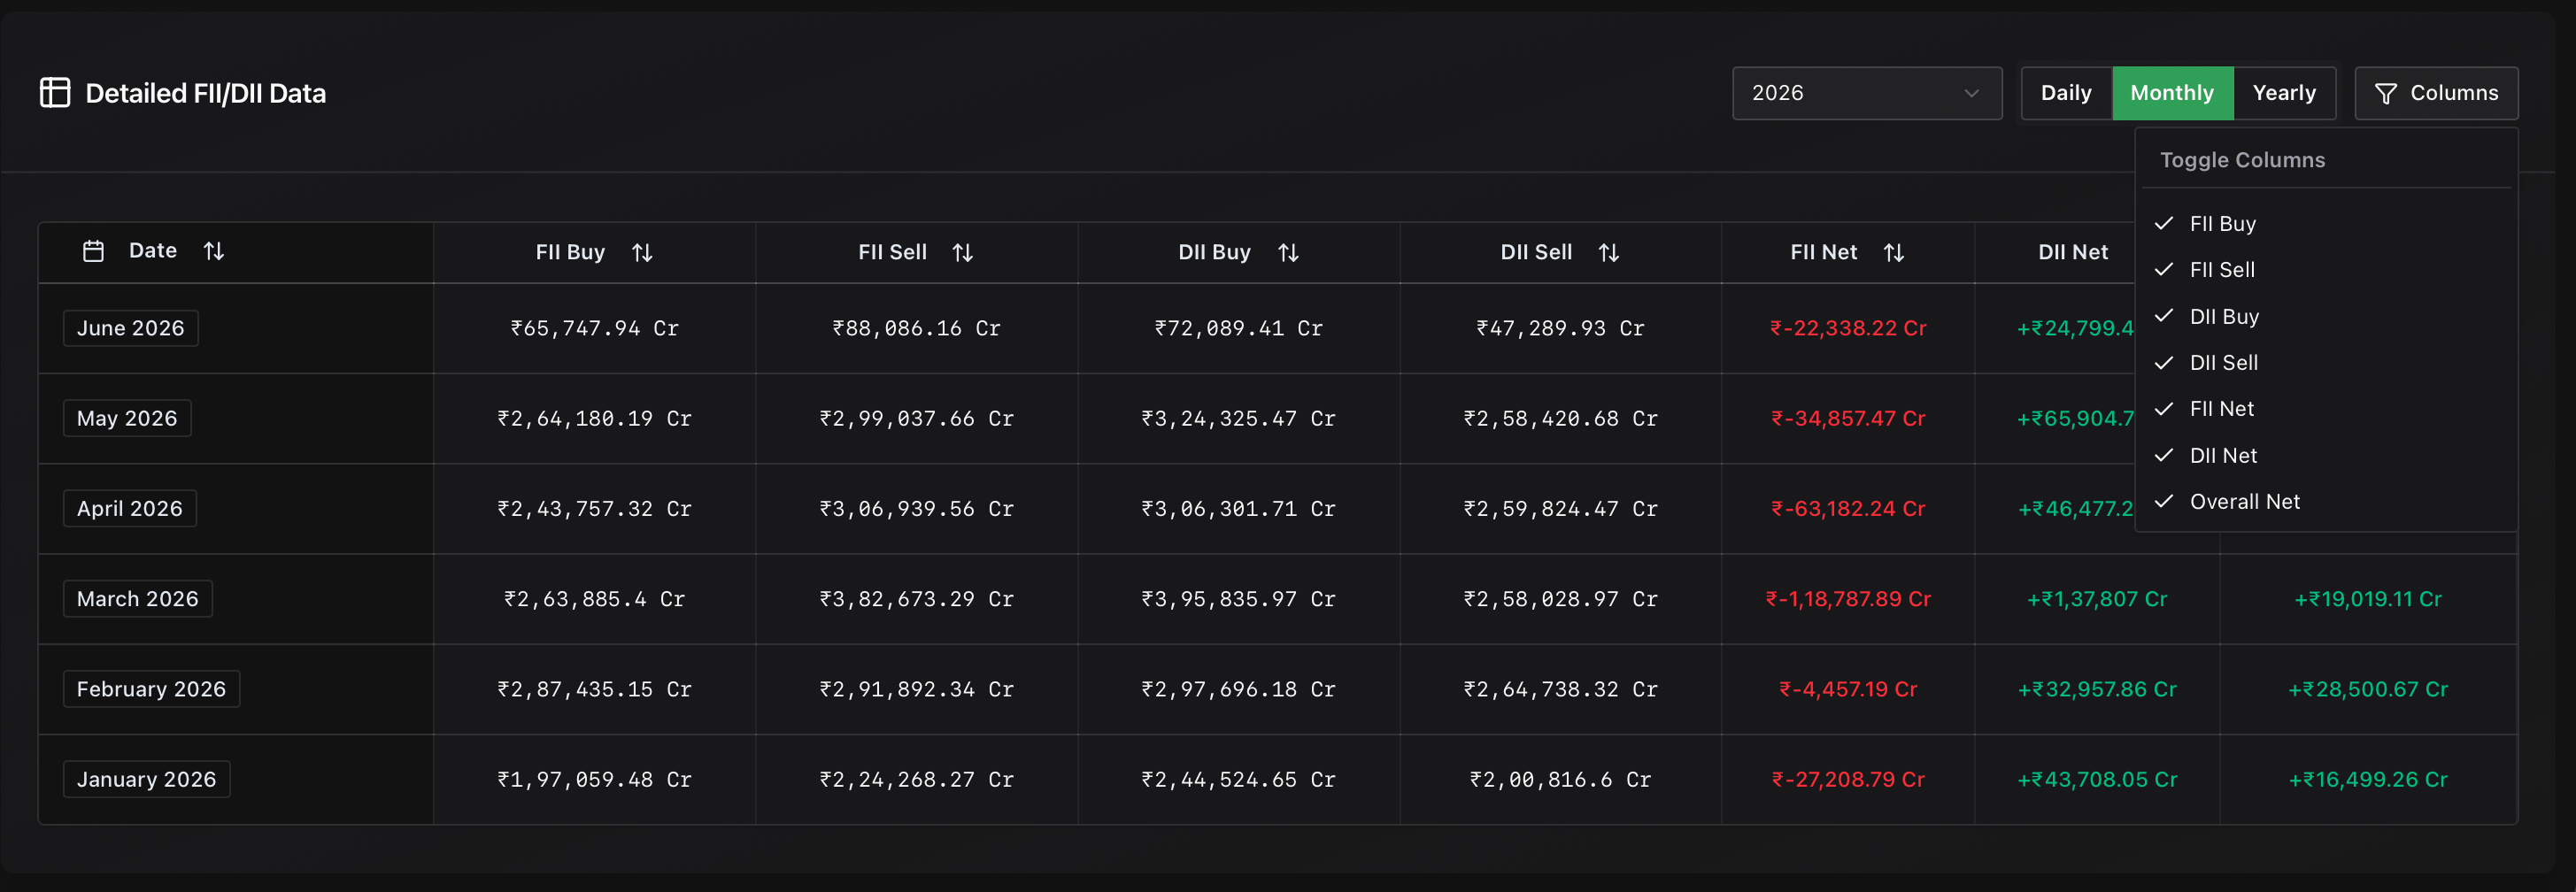
Core Mechanics:
- Time Synchronization: The ledger grid updates its rows dynamically based on whether you select Daily, Monthly, or Yearly configurations. Look closely at daily transactional breakdowns or switch views to evaluate years of historical institutional data rows.
- Bespoke Column Customization Engine: Click the Columns dropdown at the right side of the panel header to select or deselect specific variables. This allows you to completely personalize your terminal grid to only display relevant metrics, including:
- FII Buy / FII Sell absolute numbers
- DII Buy / DII Sell absolute numbers
- FII Net / DII Net standalone differences
- Overall Net combined institutional capital flows