

Most of us have searched for the best stock screener in India at some point and ended up with eight tabs open, not sure which one to actually use. Someone on Twitter swears by Screener.in, your colleague uses Trendlyne, and then there’s TradingView which looks powerful but also a bit much if you’re not a full-time trader.
This article is a straight answer to that confusion. We spent time on each platform, noted what works and what doesn’t, and wrote it up plainly. No sponsorships involved.
We’ve also included Kalpi a newer India-focused platform that doesn’t come up in most comparisons yet, but probably should. You’ll see why.
Key Takeaways
• Six platforms tested: Screener.in, Tickertape, Trendlyne, Tijori, TradingView, Kalpi • Free plans vary a lot more than feature lists suggest — some are generous, some are quietly restrictive
• No single platform wins everything — the right pick depends on what you’re trying to do • For most retail investors, combining two free tools covers 90% of what you actually need
What Is a Stock Screener?
Think of it like a shopping filter but for stocks. Instead of filtering shoes by size and colour, you’re filtering 5,000+ listed companies by things like PE ratio, return on equity, debt levels, or price momentum. Set the conditions, get the list. What would take weeks manually takes about 30 seconds.
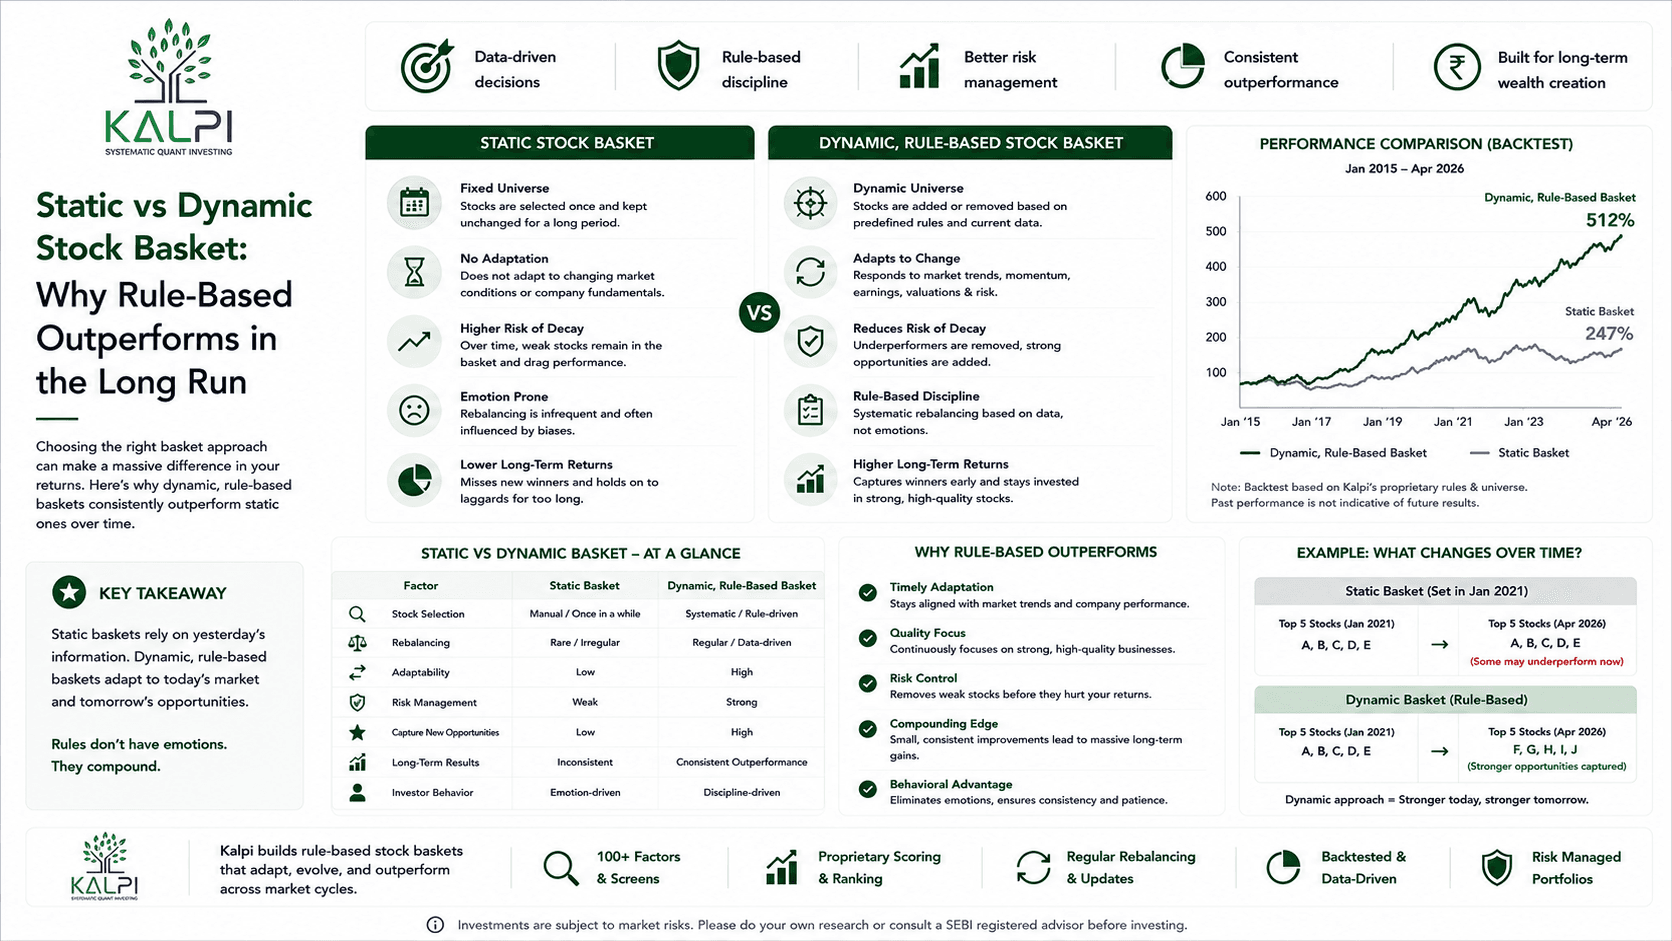
The basic ones let you filter by fundamental data PE, ROE, revenue growth, that kind of thing. The better ones layer in technical indicators, sector context, and historical returns. A few Kalpi being one also track what institutional investors are buying and which sectors are gaining or losing momentum in real time.
A screener is a starting point, not a buy signal. It narrows down the universe. The actual research still happens after.
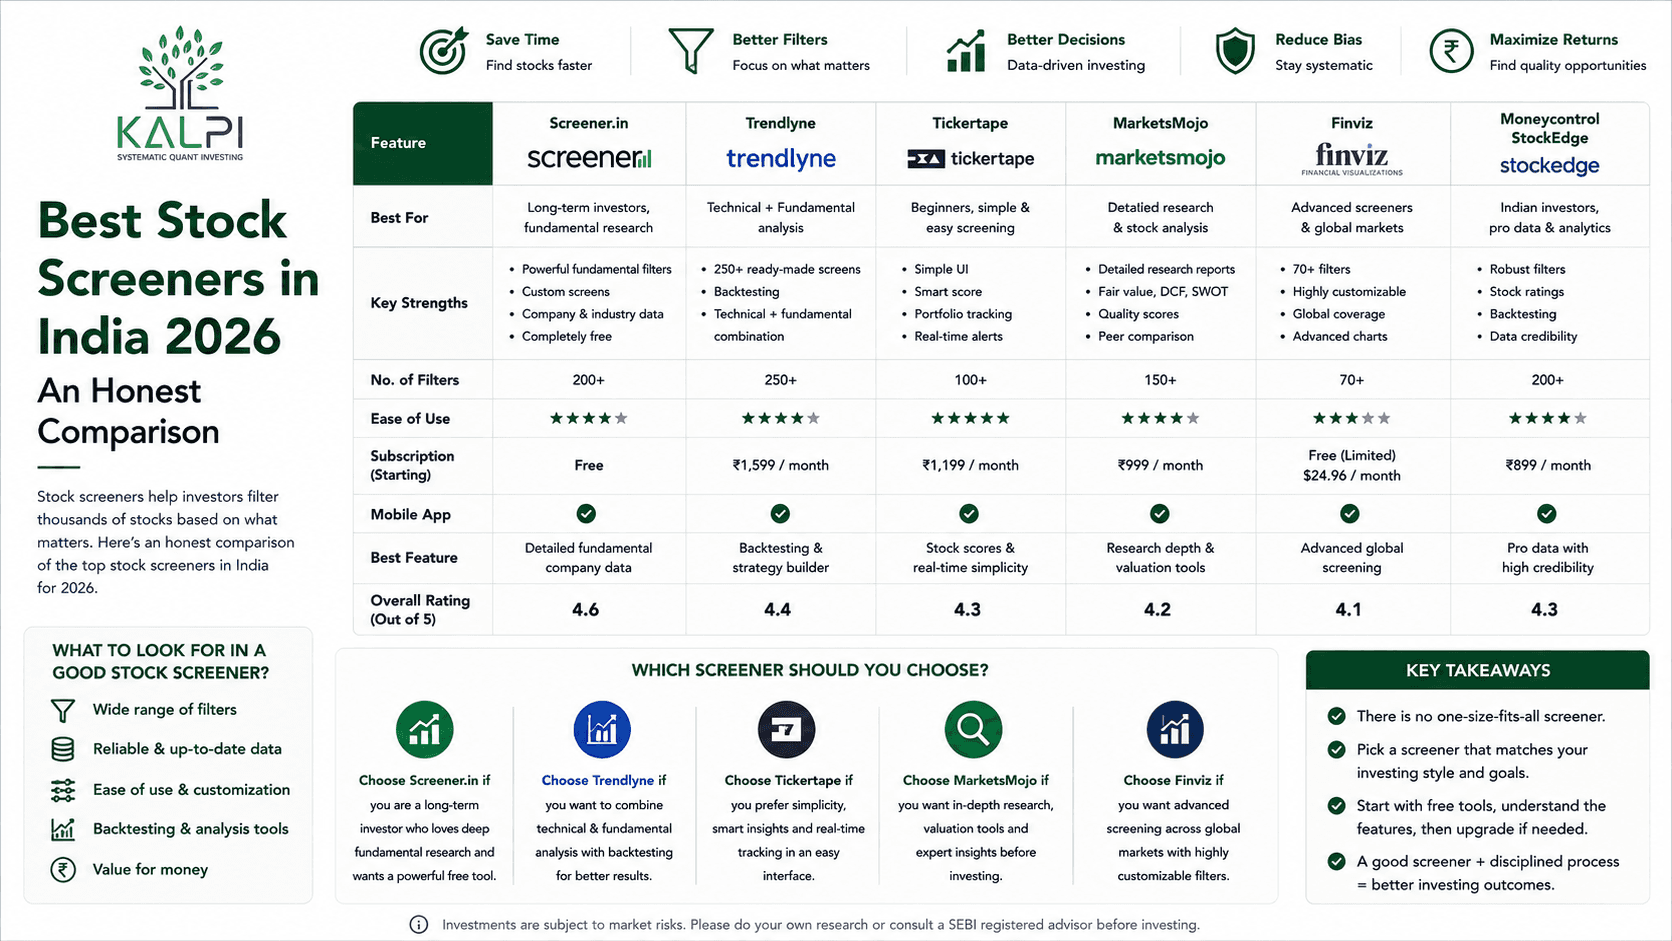
Feature Comparison
One thing to note before the table: free plan quality varies a lot more than the feature lists suggest. A platform might list all the same features but quietly lock the useful ones behind a paywall. That’s reflected below.
| Feature | Screener.in | Tickertape | Trendlyne | Tijori | TradingView | Kalpi |
| Ease of Use | Moderate | Easy | Moderate | Easy | Moderate | Easy |
| Fundamental Analysis | Excellent | Good | Good | Good | Basic | Good |
| Technical Analysis | Basic | Average | Good | Average | Excellent | Good |
| Custom Screeners | Advanced | Yes | Yes | Limited | Yes | Yes |
| Backtesting | No | No | Paid only | No | Limited | Yes |
| FII / DII Data | No | No | Paid | No | No | Yes |
| RRG Charts | No | No | No | No | No | Yes |
| Market Breadth | No | No | Limited | No | No | Yes |
| IPO Tracker | No | Yes | Yes | No | No | Yes |
| Free Plan Quality | Excellent | Good | Limited | Good | Good | Good |
| Beginner Friendly | Moderate | Yes | No | Yes | No | Yes |
| Mobile Experience | Poor | Excellent | Good | Good | Good | Good |
Ratings are relative across the six platforms, not absolute scores.
Platform Breakdown
Each platform has its own personality. A table doesn’t fully capture it, so here’s the individual take on each one.
Screener.in — Still the best for pure fundamentals
It’s been around the longest, and for fundamental analysis it hasn’t really been topped. The custom query builder is flexible you write something like roe > 15 and debt to equity < 0.5 and it just works. Ten years of financial data, all free.
The interface is dated and there’s no real charting to speak of. If you want sector context or technical signals, you’ll need a second tool alongside it. But for finding quality companies based on numbers, nothing does it better.
Best for: value investors and anyone who wants to run serious fundamental screens. Free plan: Genuinely excellent most useful features are free.
Tickertape — The most approachable for beginners
Cleaner design than most. The mobile app actually works, and their stock report cards are a good starting point if you don’t know what to look at first. Portfolio tracking has also gotten better over the past year.
Doesn’t go very deep. More experienced investors will hit the ceiling fairly quickly. Some previously free features now require Pro it’s been a gradual shift, but noticeable.
Best for: beginners and mobile-first users.
Free plan: Decent, though scope has narrowed a bit over time.
Trendlyne — Most data. Steepest learning curve.
Covers more ground than any other platform here promoter pledging, earnings revisions, insider transactions, technical signals, corporate announcements. It’s genuinely impressive in breadth.
The interface is dense, and a meaningful portion of what makes Trendlyne useful is behind a paywall. Not the place to start if you’re new to this.
Best for: experienced investors who need breadth and don’t mind paying for it.
Free plan: Functional but limited you’ll hit walls quickly.
Tijori Finance — Best for understanding one company deeply
Different in focus from the others. It’s less about screening, more about understanding. Revenue segmentation, peer comparisons, business model breakdowns done better here than anywhere else on this list. If you already have a company in mind and want to really understand it, Tijori is excellent.
The screener filters are limited. It’s not really a discovery engine.
Best for: deep research on a specific company you already have in mind.
Free plan: Good quality, but limited stock coverage.
TradingView : The only real choice for technical analysis
Nothing beats it for charts. 100+ indicators, Pine Script for custom ones, multi-chart layouts, an active community sharing strategies. For someone who lives in charts, it’s in a different category from everything else here.
Fundamental data for Indian stocks is shallow compared to the dedicated Indian platforms. Free plan restricts the number of active indicators. And it’s a global platform you won’t find the India-specific context that local tools provide.
Best for: technical traders and chartists.
Free plan: Good entry point, but limiting for active use.
Kalpi — Built specifically for the Indian market
This is where Kalpi stands apart. FII and DII flow tracking, sector dashboards, Relative Rotation Graphs, market breadth indicators, IPO tracker, and a strategy backtester all in one place, most of it free. It’s built around how Indian investors actually research, not adapted from a global platform.

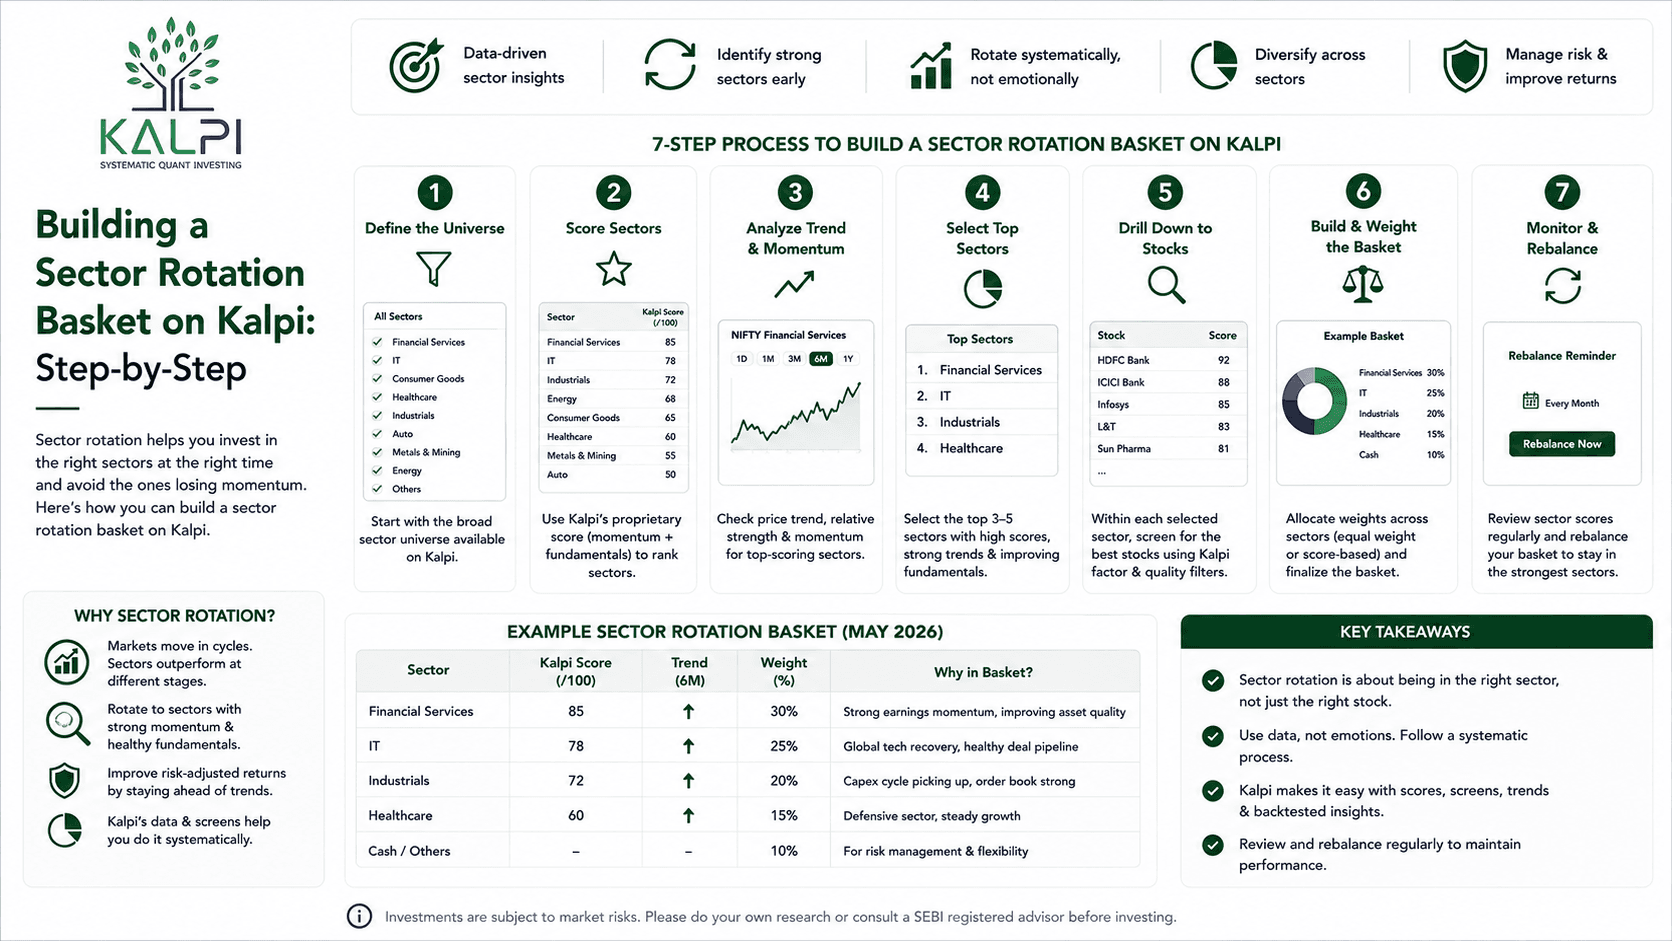
The RRG chart is a standout feature. It plots sectors by momentum and relative strength, making it easy to spot where rotation is happening before prices fully reflect it. Most Indian platforms don’t offer this at all.

The screener covers fundamentals and some technical filters. It’s not as customisable as Screener.in yet, but it handles what most investors actually need without a paywall blocking the useful parts. The portfolio analyser connects directly to your broker.
Best for: investors who want market-level context sector rotation, FII flows, breadth alongside stock level research.
Free plan: One of the more generous free tiers here. Most core research features don’t require a subscription.
SECTION 04 WHICH ONE SHOULD YOU USE?
Which One Should You Use?
The honest answer is:
it depends on what you’re trying to do. Here’s a plain guide.
| If you are… | Best pick | Why |
| Just starting out | Tickertape or Kalpi | Clean enough that you’ll actually open it daily |
| Doing fundamental research | Screener.in | 10-year data, custom filters, fully free |
| A technical trader | TradingView | Nothing comes close on charts |
| Researching sectors | Kalpi | FII data, sector dashboards, RRG — all free |
| Deep-diving one company | Tijori Finance | Revenue segmentation and peer comparisons are best here |
| If you are… | Best pick | Why |
| Want one paid tool | Trendlyne | Most comprehensive data depth if you’re serious |
For most retail investors: Screener.in for stock-level fundamental research plus Kalpi for sector context and market data covers roughly 90% of what you need both free. Add Trading View only if charts matter to you.
SECTION 05 FREQUENTLY ASKED QUESTIONS
Questions People Ask
Is Screener.in really free?
Yes, and genuinely so. Ten years of financials, custom queries, basic export all without paying anything. The Pro plan adds unlimited saved screens and some extras, but most users won’t need it.
What is the best free stock screener in India right now?
Screener.in for fundamentals. Kalpi for market-level and sector data. Between the two, you cover most of what a retail investor needs without spending anything.
Is Tickertape better than Screener.in?
They’re solving different problems. Tickertape is better for someone who wants a clean overview and a usable mobile experience. Screener.in is better when you want to dig into financials with custom filters. A lot of investors use both Tickertape for a quick read, Screener.in to go deeper.
Which platform has a free backtester?
Trendlyne has one but it’s paywalled. Kalpi’s backtester works on the free plan for basic strategy testing. It’s not the most advanced, but it’s accessible without paying — and it runs on real NSE data.
Does any Indian screener track FII and DII activity?
Trendlyne does, partially behind a paywall. Kalpi tracks FII and DII flows on the free tier and presents it clearly. It’s one of the more useful features if you want to understand what institutional money is doing.
Do I need to pick just one platform?
No. Most serious investors use two or three. They complement each other more than they overlap. The typical setup is Screener.in or Trendlyne for stock research, TradingView if charts matter, and Kalpi for overall market context. You don’t need to pay for all of them.