

Get Your Portfolio's Report Card in Seconds
Health score, overlap, risk and fee drag for your stocks and funds.








Pulled down by more risk than your profile allows.
9 funds
How to Raise Your Score
Up to +20 PointsFindings explain what the data shows. They are not investment advice.
A Health Check Before You Change Anything
See what you own, what it costs and where the risk sits.
Fee Drag
₹2,870a year
Paid in commission by one sample portfolio on regular plans.
Health score, graded A to D
Four equal pillars, from diversification to risk
100points
Checks on your funds
Overlap, concentration, costs and exit loads
11
On every plan
Read-only, from five Indian brokers.
₹0
Your Whole Portfolio on One Screen
Worth, returns, costs and health, then the signals, pillars and checks behind each grade.
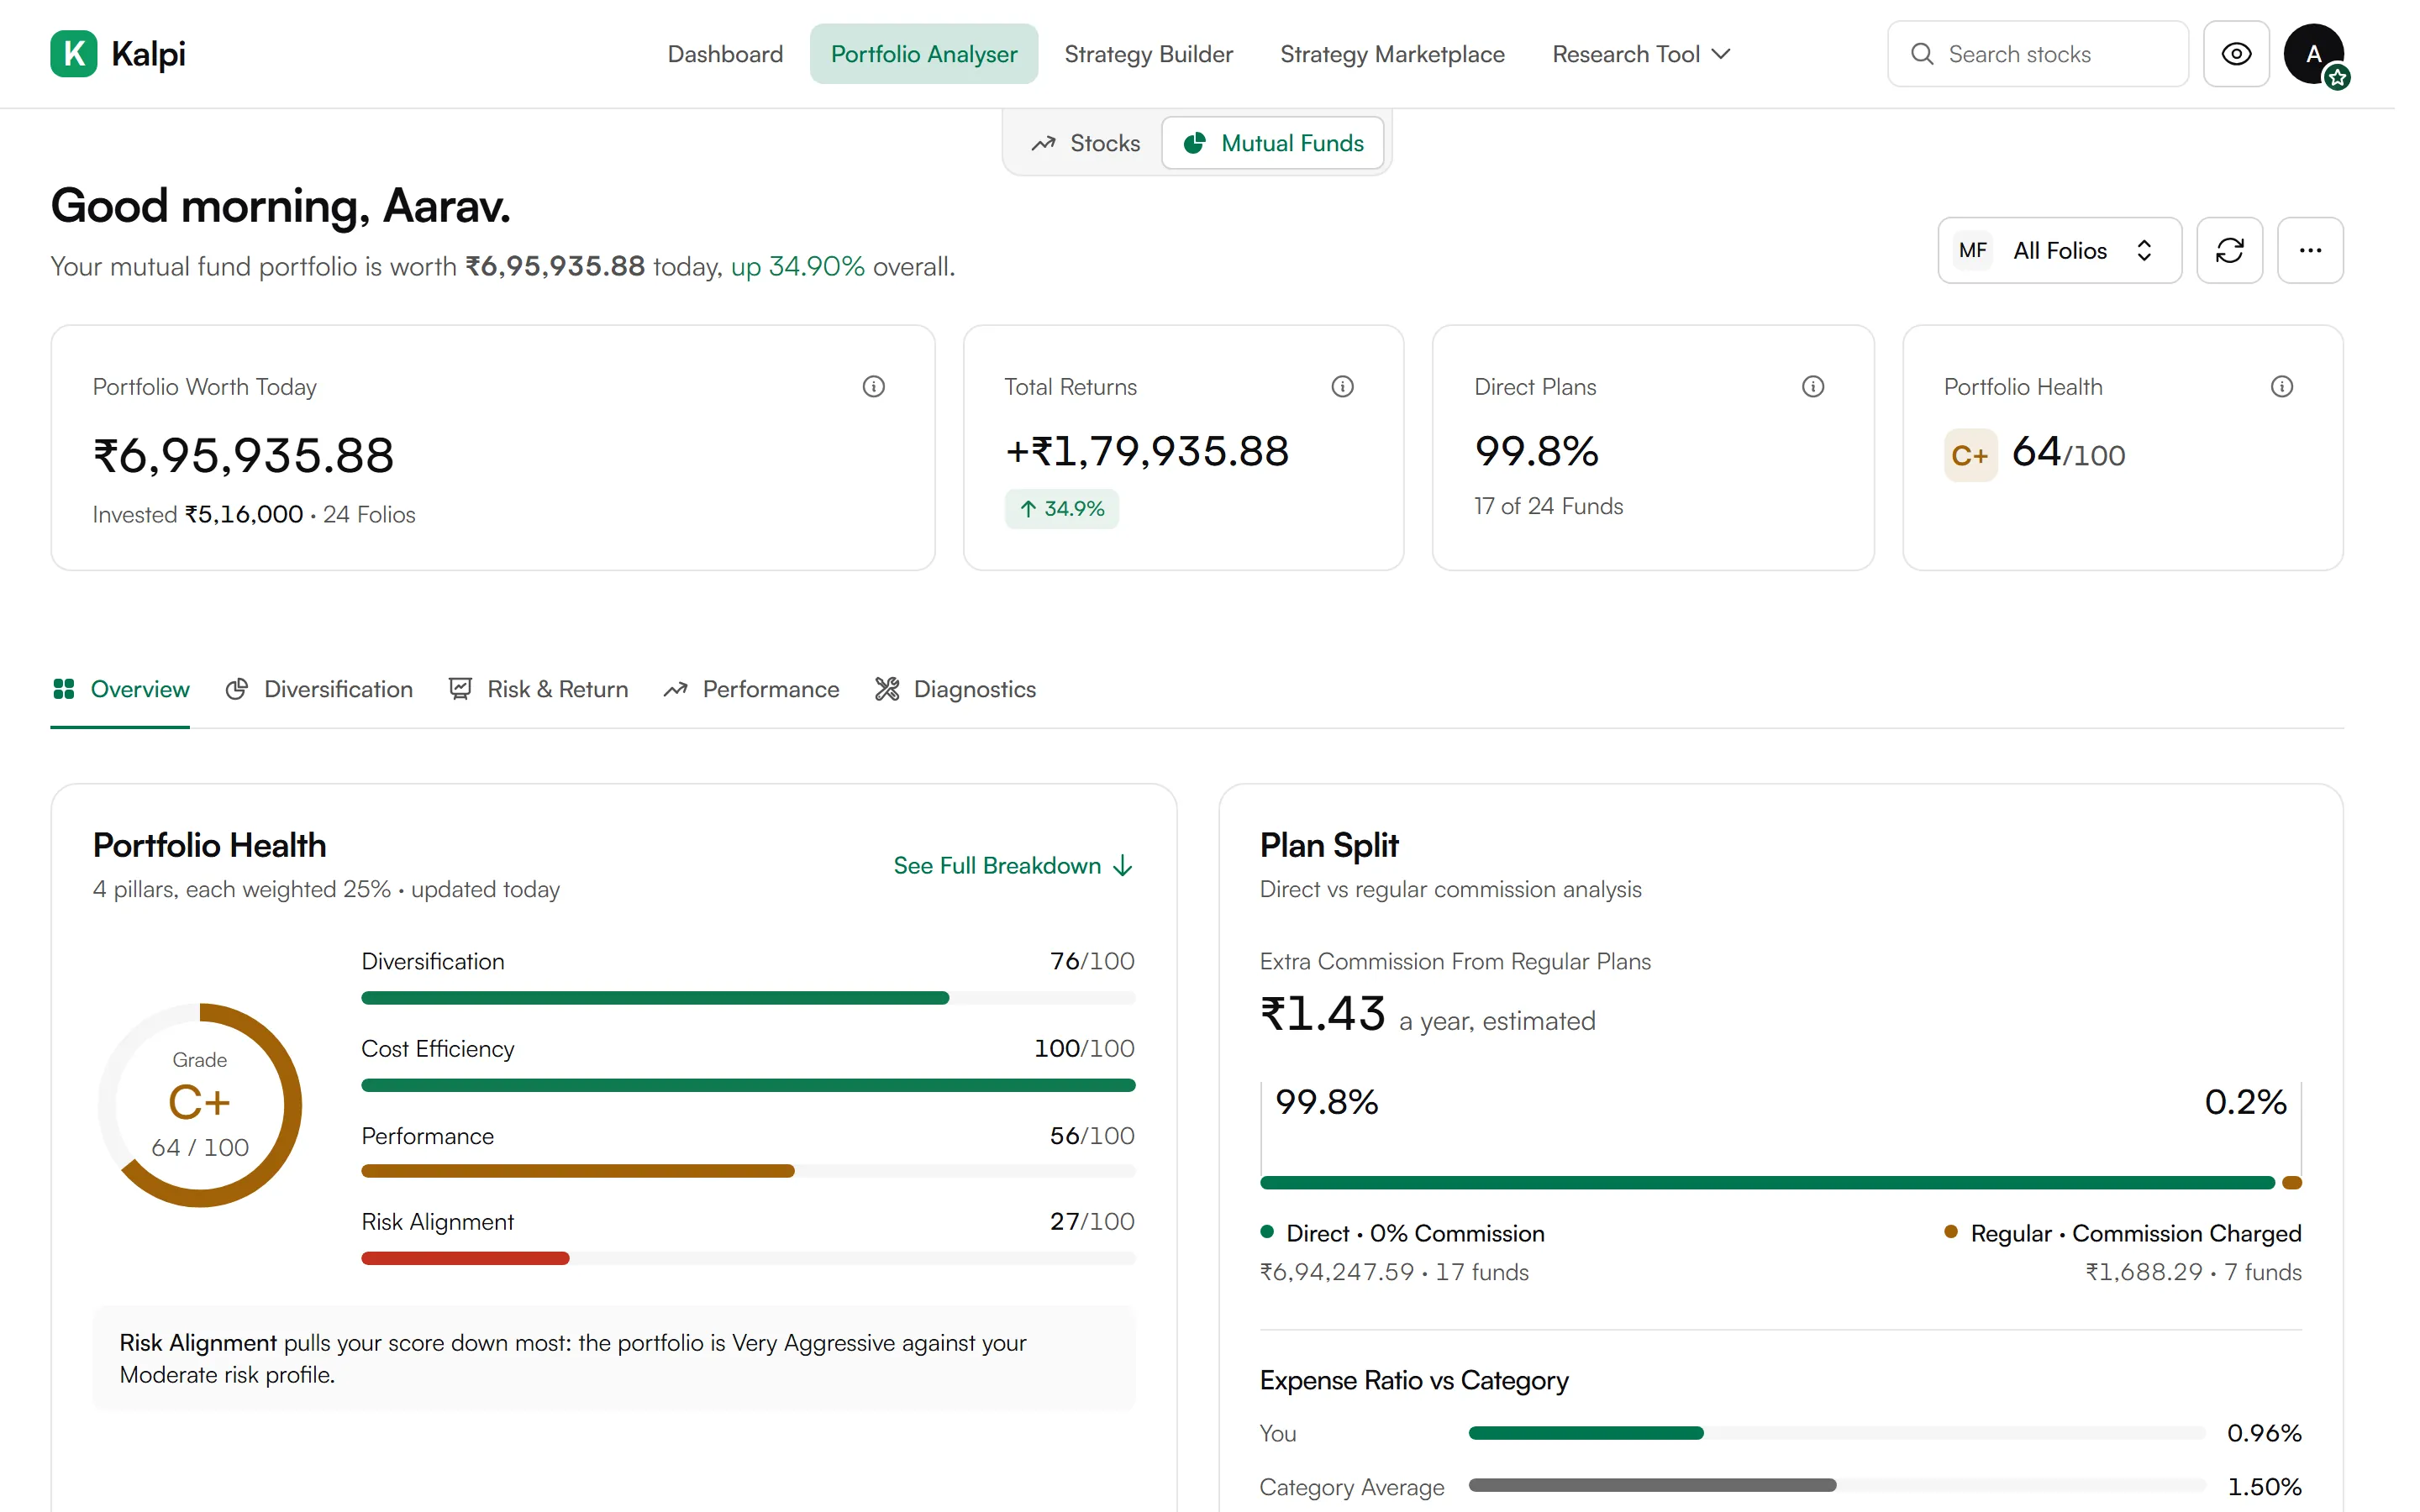
Portfolio Health Analysis
Strong returns for the risk taken.
Your Money By Signal
- Strong₹2,13,322.70
- Weakening₹83,474.10
- Caution₹97,386.45
- Recovery₹69,561.75
Core Insight
Beating the market: 14.2% in a year, against 9.8% for the Nifty 500.
Strengths2
- Quality tilt: 6 of 8 holdings with ROE above 15%
- Low churn: most held over a year
Weaknesses2
- Sector concentration: banking and IT at 48%
- Laggard drag: one holding down 18.7%
Opportunities2
- Diversification gap: consumer and healthcare at 21%
- Single-stock risk: largest holding at 22%
Threats2
- Market sensitivity: beta of 1.1
- Rate risk: bank margins narrow if rates fall
8 stocks
How Your Score Breaks Down
Each pillar counts for 25%.
- Risk Alignment37/100
46% in small and mid caps, above your Moderate profile.
- Performance66/100
6 of 9 funds beat their category over 3 years.
- Diversification72/100
One fund house holds 35.6%. Two funds overlap 42%.
- Cost Efficiency81/100
28% sits in regular plans that pay commission.
Diagnostics
11 checks
- AMC ConcentrationOne fund house holds 35.6%, above the 25% limit.Issue
- UnderperformerOne fund is 8.4% behind its category over 3 years.Issue
- Fund OverlapTwo flexi cap funds share 42% of their holdings.Issue
- Regular Plans3 funds pay distributor commission, ₹2,870 a year.Warning
- Exit LoadOne fund charges 1% if you sell before 20 Dec 2026.Warning
- Expense Ratio0.68% a year, against 0.92% for similar funds.Passed
Showing 6 of 11 checks
Eight Questions About Your Money
Portfolio Analyser checks each one and answers in plain words.
Overview
What do I own, and what is it worth?
Your holdings, their worth today and the headline finding.
Factor Score
What kind of portfolio do I really own?
Your mix of Momentum, Value, Quality and Low Volatility.
Risk and Return
Is the return worth the ride?
Your volatility against the index, and a bad-day loss.
Diversification
Is one bet carrying too much?
Spread by company size, sector and fund house.
Fundamentals
Am I paying a fair price?
Your P/E, P/B and dividend yield against the Nifty 50.
Performance
Am I actually ahead?
Your returns next to the index, for the same period.
Diagnostics
What is quietly costing me?
11 checks, from fund overlap to exit loads and regular plans.
Health Score
Which part pulls my score down?
Four pillars, 25% each.
The Score Says How. The Detail Says Why.
For funds, what your plans cost. For stocks, what to look at first.
See What Regular Plans Cost You
Regular plans pay a distributor every year. Direct plans do not.
Plan Split
Extra commission on your 3 regular funds.
You pay 0.24% a year less than similar funds.
Findings, Ranked by Impact
Concentration, risk and laggards, most impact first.
Needs Attention
Most impact first- Banking and IT make up 48% of your moneyHigh
- Your largest holding is 22% of your moneyHigh
- A beta of 1.1 makes market falls hit harderMedium
- One holding is 18.7% below your buy priceMedium
Ask Kalpi AI About Your Portfolio
Kalpi AI answers in plain words, from your own holdings.
- Answers From Your Report
- Charts for Returns, Sectors and Costs
- Says Plainly What It Cannot Do
Kalpi AI
Portfolio AnalyserHow has my portfolio performed?
Up 14.2% in 12 months, against 9.8% for the Nifty 500.
Which sectors do I hold most?
Banking 29% and IT 19%: 48% of your money in two sectors.
What do regular plans cost me?
3 regular plans pay about ₹2,870 a year in commission.
Read-Only, and Yours to Delete
Kalpi can see your holdings but cannot move money or place orders.
- What We Store
Holdings, quantities and buy prices, kept while your account is open.
- Delete It Any Time
Remove a broker or CAS in Settings, and its holdings go too.
- Hide Your Numbers
One tap blurs every rupee figure on screen.
Read-Only Access
Kalpi Can
- See the holdings you connect, upload or add
- Work out your report card and findings
- Answer your questions about them
Kalpi Cannot
- Move your money or place orders from the Analyser
- See your broker password
- Share or sell your portfolio data
Can I use it without connecting a broker?
Yes. Upload a CAS for your funds, or add holdings by hand.
Which brokers can I connect?
Zerodha, Groww, Upstox, Angel One and Fyers, read-only. To invest through Kalpi, use your own account with Zerodha, Upstox, Angel One or IIFL Capital.
What does my health score mean?
A score out of 100, graded A to D. Stocks weigh risk, concentration and performance; funds use four equal pillars.
Is my portfolio data shared with anyone?
No, it is never shared or sold. You can delete it from Settings at any time.
Which plans include Portfolio Analyser?
Every plan. Paid plans add more broker connections and longer history (see Pricing).
See How Healthy Your Portfolio Really Is
On every plan. No broker needed.