

 HDFC Bank
Data You Can Check, Not Tips
Checked against NSE and BSE data every market day.
5,000+
Indian stocks, each with its own page.
- Indices
- 196
- Sectors
- 53
- Market tools
- 10
- Tabs on every stock
- 5
Data from the exchanges


Open Any Stock, Check Any Market
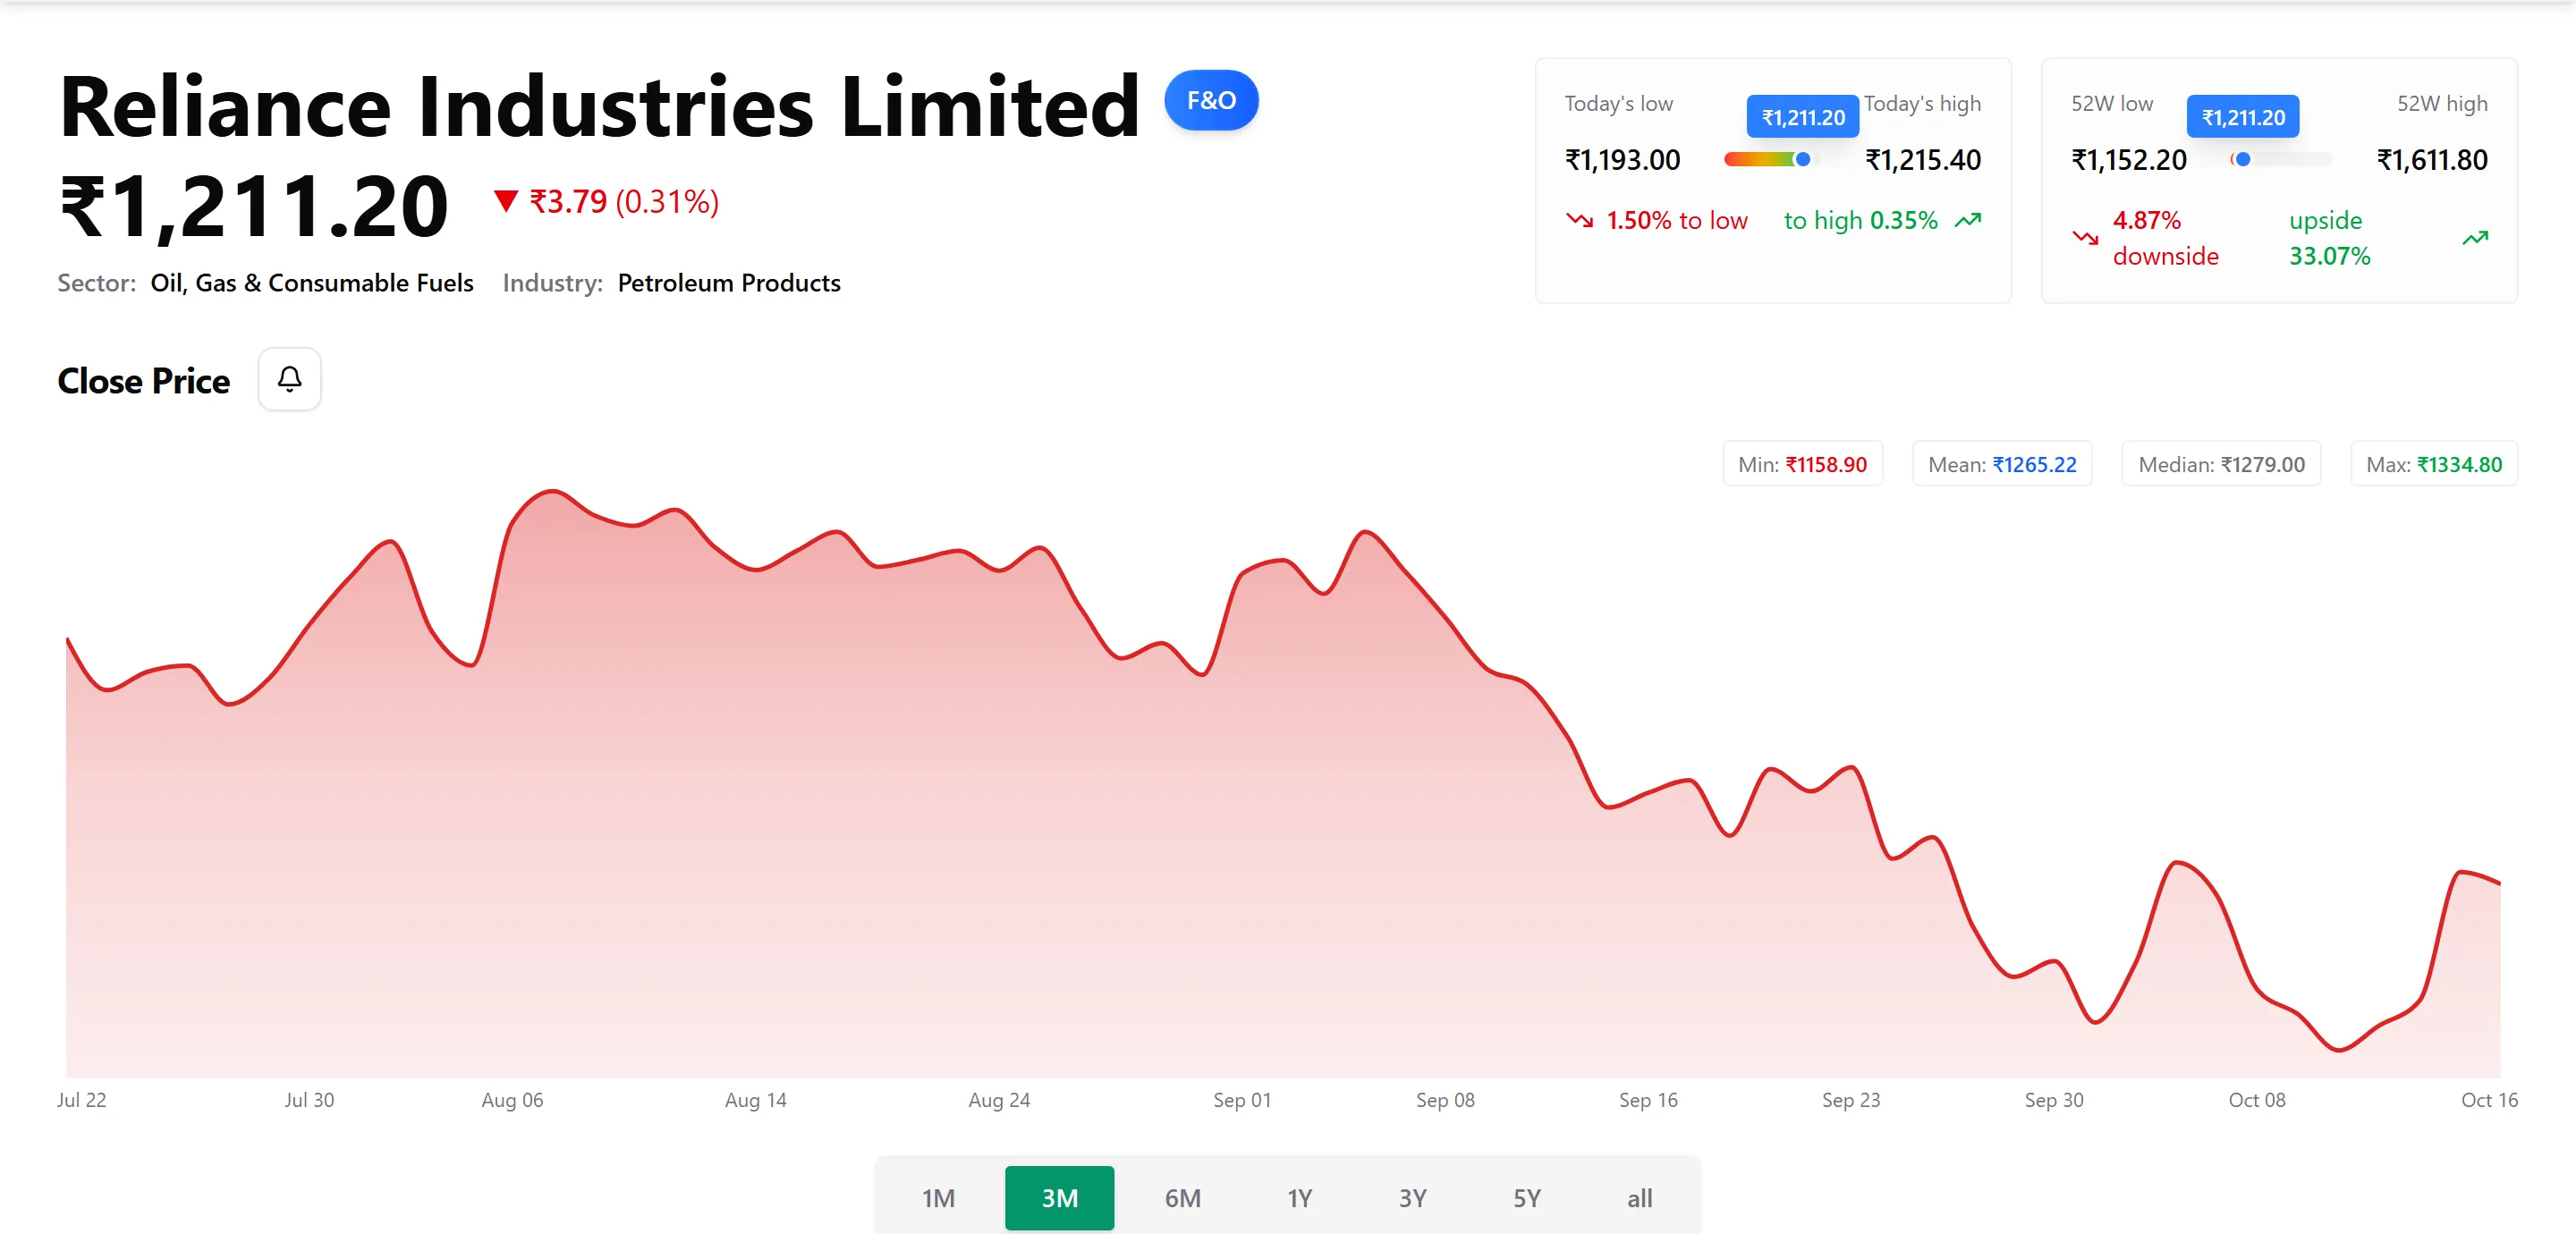
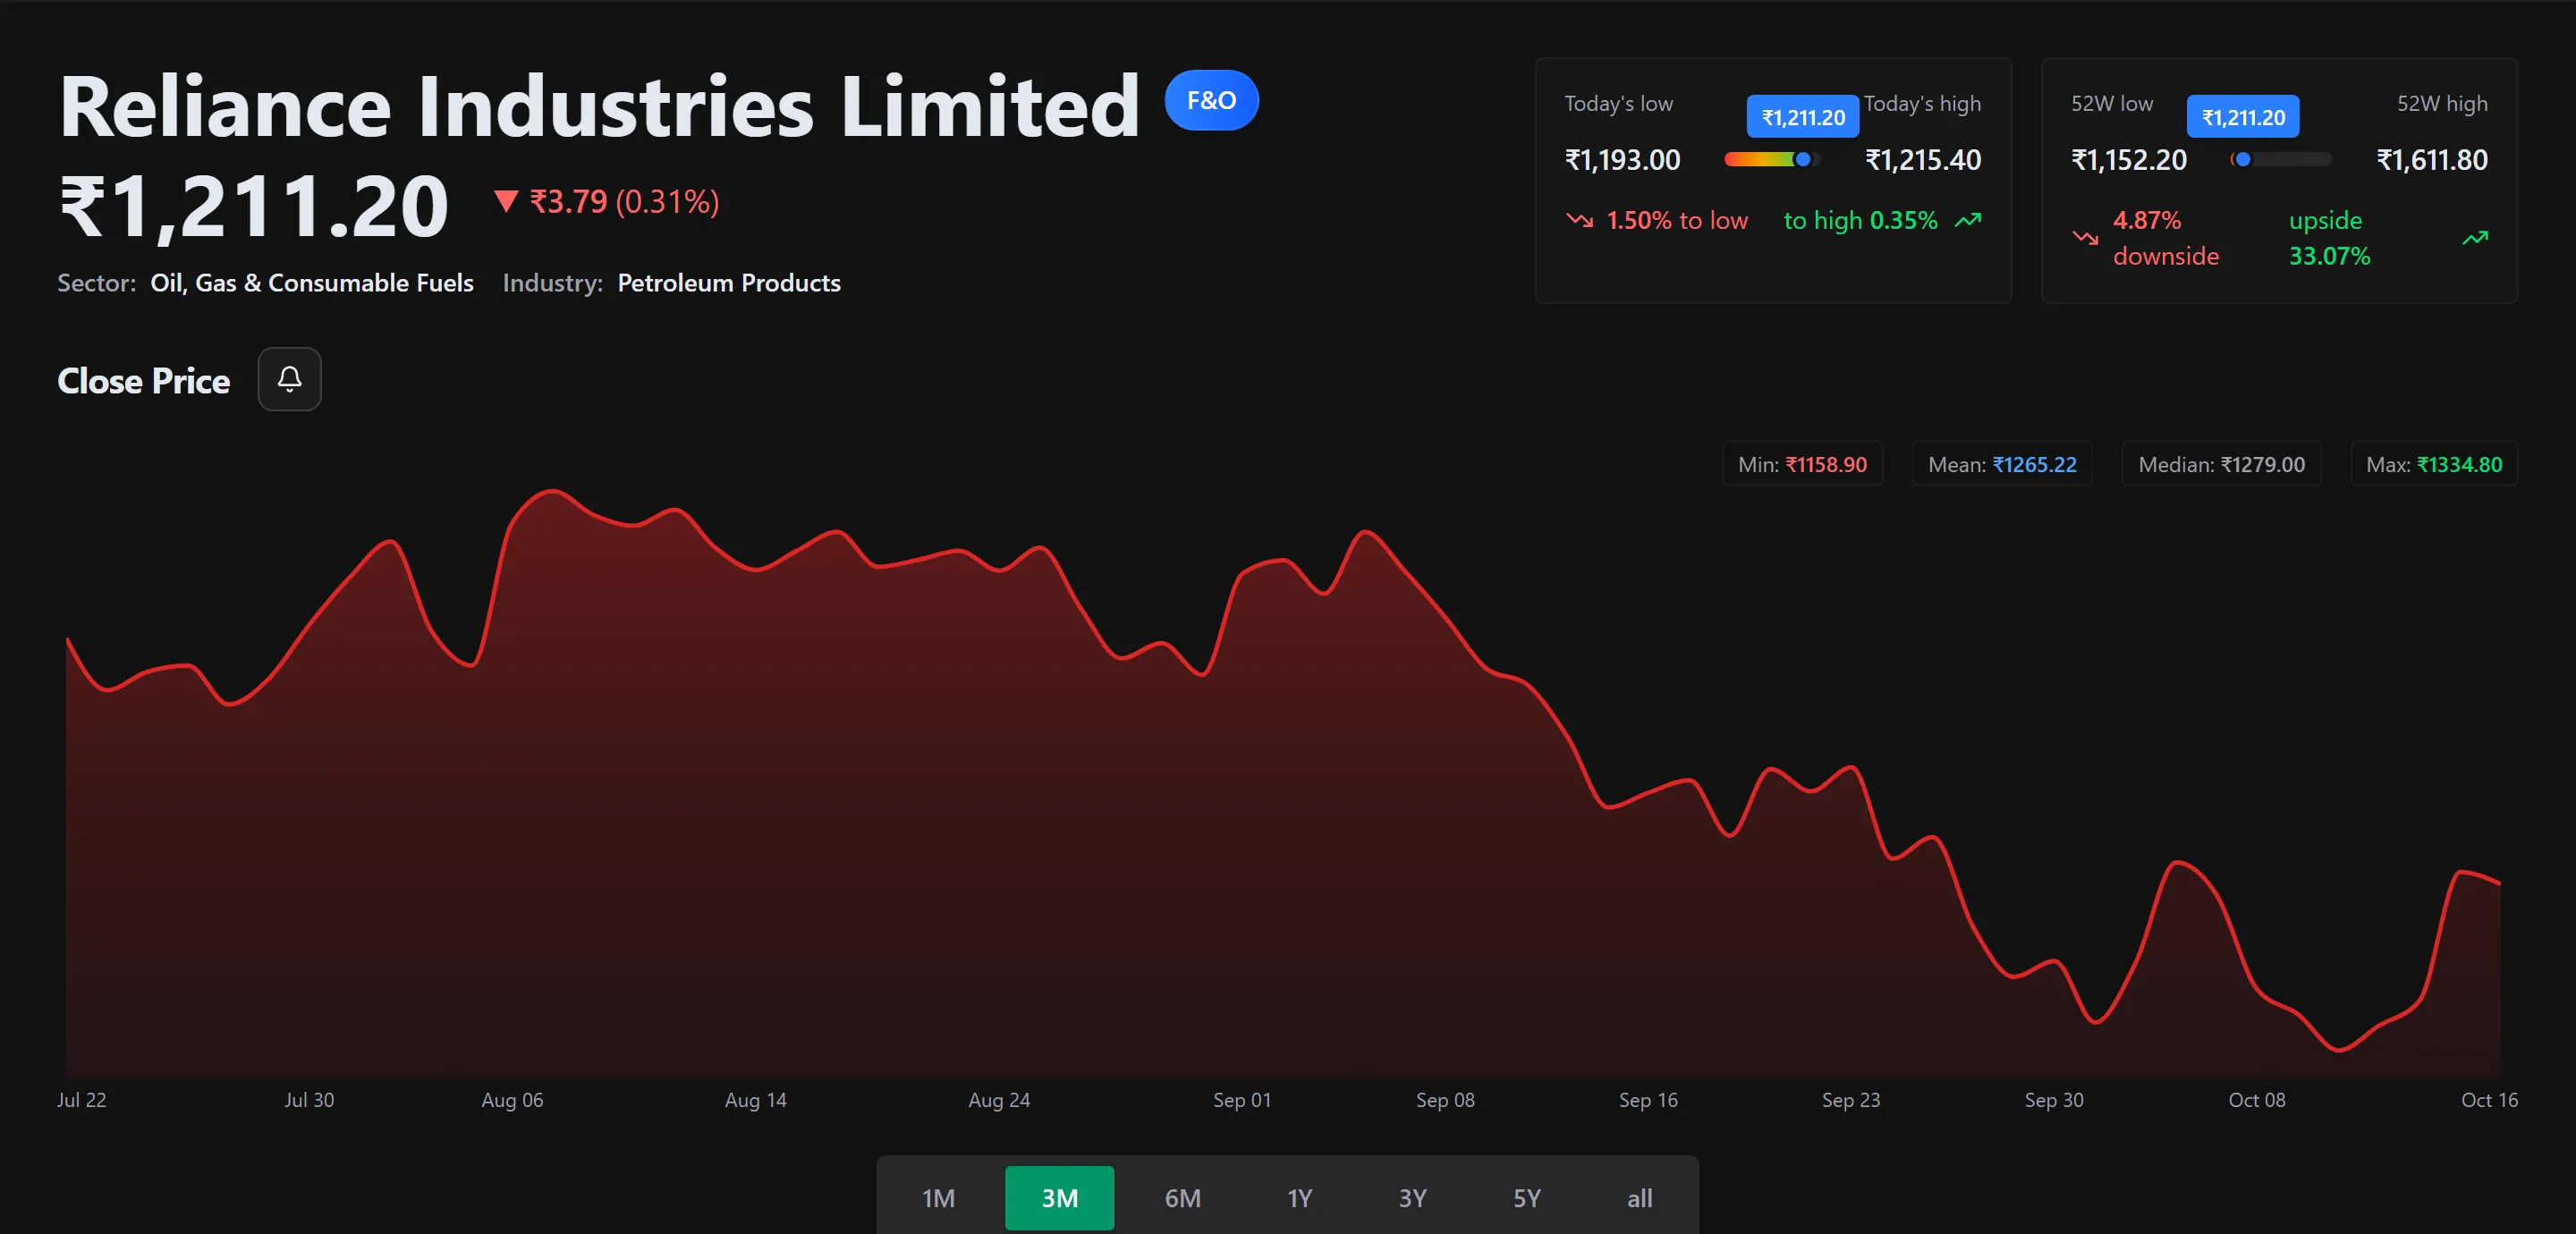
A live stock page on kalpi.ai.
Reliance Industries on kalpi.ai. Not a recommendation.
Every Stock Page, Tab by Tab
The same five tabs on every stock.
Price, Ranges and Returns
- Today's range and the 52-week low and high
- Close price from one month to all history
- Scores for volatility, momentum, value and quality
- Returns from one day to five years, and rolling returns
Returns
Rolling 1-Year Return
1Y3Y5YIndicators and Patterns in One View
- Moving averages, RSI and MACD on one screen
- Chart patterns named in plain words
- A How to Read This guide beside each section
Price and Moving Averages
- Price against 200-day average12.7% above
- RSI (14 days)58, Neutral
- MACDAbove signal line
- PatternHigher highs and lows
Risk, Strength and the Usual Range
- Volatility and risk-adjusted returns
- Relative strength against the Nifty 50
- Z-score: how far today sits from the usual range
Statistical
Relative Strength Against the Nifty 50
How Each Month Has Gone
- Average and median return by month
- The share of years each month ended up
- Two symbols side by side
Average Return by Month
- Jan
- Feb
- Mar
- Apr
- May
- Jun
- Jul
- Aug
- Sep
- Oct
- Nov
- Dec
Past patterns do not predict future returns.
What Is Due Before You Buy
- Dividends, results, bonus issues, splits and buybacks
- Past and upcoming events on one timeline
- Record dates, so you know who gets what
Corporate Events
- 9 Jan 2027ResultsIn 88 days
Quarterly Results
October to December quarter
- 17 Oct 2026DividendIn 4 days
Interim Dividend, ₹11 per Share
Record date
- 13 Oct 2026Today
- 9 Oct 2026ResultsPast
Quarterly Results
July to September quarter
- 16 Jul 2026DividendPast
Interim Dividend, ₹11 per Share
An account unlocks the full analysis, watchlists and alerts.
The Market Today, in One Glance
Indices, sectors, breadth and who is buying.
Indices
- Nifty 50NSE25,146.30▲ 0.42%
- SensexBSE82,327.05▲ 0.38%
- Nifty BankNSE56,192.85▲ 0.71%
- Nifty 500NSE23,418.60▲ 0.29%
- Nifty Midcap 150NSE21,734.15▼ −0.18%
One month, daily close
Sectors
- Metals▲ 2.05%
- PSU Banks▲ 1.91%
- Auto▲ 1.68%
- Banking▲ 1.24%
- Financial Services▲ 0.97%
- Pharma▲ 0.52%
- Energy▲ 0.44%
- Consumer Durables▲ 0.18%
- Media▼ 0.12%
- FMCG▼ 0.31%
- Information Technology▼ 0.86%
- Realty▼ 1.42%
Market Breadth
Advances and Declines
13 Oct 2026% of Stocks Above 200-Day Average
FII and DII Activity
Net Flows, Last 10 Sessions
FIIDIIFIIs sold on 4 of the last 5 sessions.
Know What Is Coming Up
Results, dividends, splits and every IPO, from open to listed.
- SAIPO Open
Sahyadri Agro Foods
Price Band₹212 to ₹224Lot Size66 sharesCloses 16 Oct 2026Subscribed 2.4 times - BFResults
Bluepeak Fluorochem
Quarterly
July to September quarter
30 Oct 2026In 17 days - TSDividend
Tarangini Software
Interim, ₹12 per Share
Record date
21 Oct 2026In 8 days - NCIPO Upcoming
Nilgiri Cold Chain
Price Band₹96 to ₹101Lot Size1,200 sharesOpens 22 Oct 2026In 9 days - KABonus
Kestrel Auto Parts
1 for 2
One bonus share for every two held
24 Oct 2026In 11 days - SHSplit
Silverline Home Decor
₹10 to ₹2 Face Value
Each share becomes five
28 Oct 2026In 15 days - KSListed
Konkan Solar Systems
Issue Price₹340Listing Price₹382.15Listed 9 Oct 2026▲ 12.4%
Every Research Tool
Each tool opens on kalpi.ai.
Markets
How the whole market and each sector are moving.
Companies
One company at a time, and what is coming up.
Money Flows
Who is buying and selling, and how much.
Popular Pages
Go straight to a stock, an index or a sector.
Where does the data come from, and is it live?
From NSE and BSE. Prices may be delayed by up to 15 minutes.
Which stocks are covered?
More than 5,000 Indian stocks, plus 196 indices and 53 sectors.
Do I need an account?
No. Stock pages and market tools are open to everyone.
Is anything on these pages a recommendation?
No. The pages show data and analysis, not tips or advice.
How do I turn research into a strategy?
Pick an index, add filters and a ranking, then backtest. See how backtests work.
Look Up Your Next Stock
Open any NSE stock and read its five tabs.