

Last Updated: July 2026
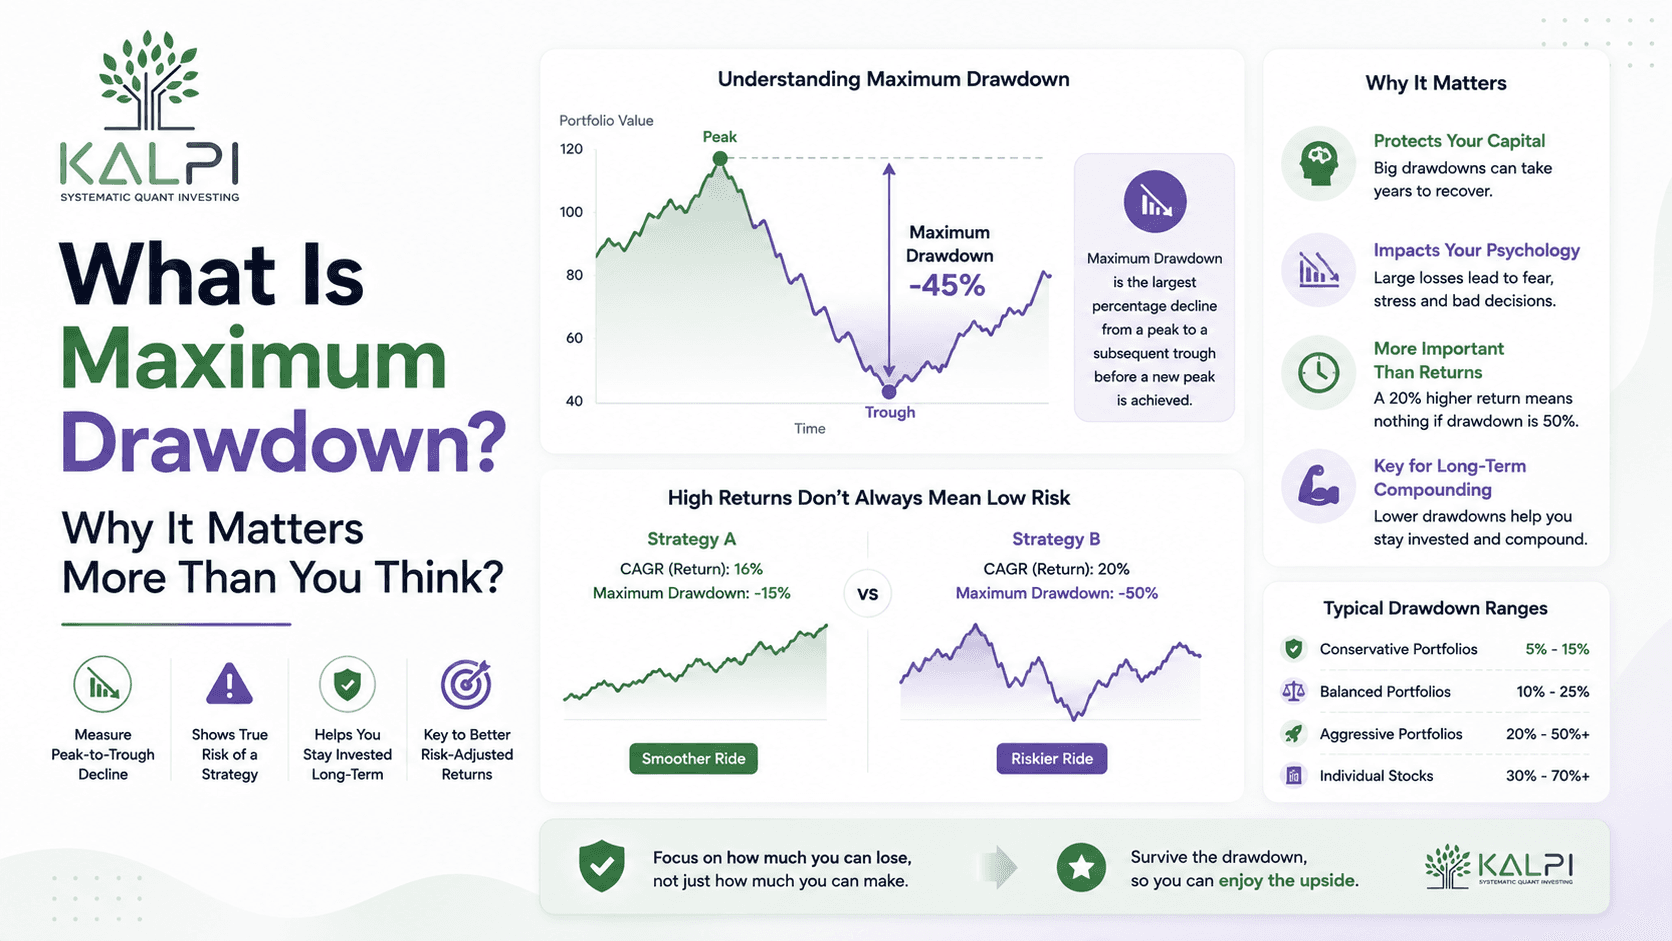
Maximum Drawdown measures the biggest fall in the value of an investment or portfolio from its highest point before it starts recovering. It helps investors understand the worst loss they could have faced during a specific stretch of time. Looking at Maximum Drawdown alongside returns gives a fuller picture of both the potential gains and the risk sitting underneath them.
Why Looking Only at Returns Can Be Misleading
Say you’re driving from Delhi to Jaipur with Google Maps open. Everything goes fine until you miss a turn. The app tells you to double back, tacking another 20 kilometres onto the trip. You still get there, but the detour makes the whole thing longer and a lot more annoying than you expected.
The stock market has a habit of doing something similar. A portfolio can deliver strong long-term returns, yet the path to get there is rarely a straight line. There are stretches where the value drops sharply before climbing back up. If you only look at the final return, you miss a big chunk of what actually happened along the way.
That’s part of why seasoned investors keep an eye on Maximum Drawdown. Returns matter, sure, but they usually ask one more question before forming a judgement. How much did the portfolio fall before it found its footing again? The answer tells you a lot more about the risk an investor had to sit through while staying invested.
What Is Maximum Drawdown?
Maximum Drawdown is the largest percentage decline from the highest value an investment reaches to its lowest point before it starts climbing back up. Rather than tracking every small wiggle in price, it zeroes in on the single biggest fall during whatever period you’re looking at.
Say you put ₹5,00,000 into a portfolio. Over time it grows to ₹6,50,000. Then a market correction hits and it drops to ₹4,90,000 before slowly recovering. That fall from ₹6,50,000 down to ₹4,90,000 is the Maximum Drawdown.
It doesn’t matter how fast the portfolio bounced back afterward. Maximum Drawdown just measures how deep the decline went before the recovery kicked in. Put simply, it shows the worst setback an investor would have lived through while holding that investment.
Why Maximum Drawdown Matters More Than Returns Alone
A lot of investors compare portfolios purely on annual returns, and that can paint a misleading picture.
Picture two investment portfolios. Both averaged 15% a year over the last five years. At first glance, they look equally good.
Dig a little deeper, though. The first portfolio never fell more than 8% during market corrections. The second one dropped almost 40% before finally clawing its way back. Same returns, completely different ride.
Plenty of investors would struggle to stay put after watching nearly half their portfolio vanish, even if the drop turned out to be temporary. Maximum Drawdown captures how rough that experience actually was, not just where it ended up.
Why Every Investor Should Understand Drawdown
No market climbs in a straight line forever. Even solid businesses go through rough patches. Economic slowdowns, global shocks, interest rate changes and sudden bad news can all drag prices down for a while. This is just part of investing, not an exception to it.
The real question isn’t whether a portfolio will face a drawdown. Almost every portfolio does, sooner or later. What actually matters is how deep that drawdown could go.
Understanding drawdown gets investors mentally ready for volatility instead of pushing them toward panic decisions when prices fall. It also makes comparing strategies a lot easier. Sometimes a portfolio with slightly lower returns but much smaller drawdowns ends up being far easier to hold onto over the years than one chasing higher returns through frequent, sharp declines.
Returns Tell You the Destination, Drawdown Shows the Journey
Picture two flights going from Mumbai to Bengaluru, both landing at exactly the same time. One glides through without a hitch from take-off to landing. The other bounces through heavy turbulence for most of the flight.
Both passengers reach the same city, but their experience along the way couldn’t be more different.
Portfolios work no differently. Returns tell you where the investment ended up. Maximum Drawdown tells you what you had to go through to get there. That’s why experienced investors rarely stop at checking returns alone. They also want to know how deep the portfolio fell during rough patches and whether that kind of risk actually suits their own comfort level.

A cumulative returns chart like this one makes the biggest peak-to-trough fall easy to spot, which is exactly what Maximum Drawdown measures.
How Is Drawdown Calculated?
Working out a drawdown sounds trickier than it is. It simply compares the highest value a portfolio reaches with the lowest point it falls to before recovery kicks in.
The formula looks like this:
Maximum Drawdown = (Peak Value − Lowest Value) ÷ Peak Value × 100
You won’t need to do this by hand most of the time. Portfolio analysis tools calculate it automatically. Still, knowing what the number actually represents makes it a lot easier to read investment risk correctly.
Take a simple example. Say your portfolio grows from ₹2,00,000 to ₹2,80,000. A correction hits, and it slides to ₹2,10,000 before climbing again. The drawdown is measured from the peak of ₹2,80,000, not from what you originally put in.
Here, the portfolio lost ₹70,000 from its peak, which works out to a 25% Maximum Drawdown. Even if the portfolio later hits a new high, that 25% stays on record as the biggest fall from that particular stretch.
Once this one calculation clicks, comparing different portfolios becomes a lot simpler.
Why Maximum Drawdown Matters During Market Corrections
Market corrections happen more often than most new investors expect. Prices fall, sentiment turns sour, headlines get gloomy. Some portfolios bounce back within weeks. Others take months, sometimes years, to recover fully.
This is exactly where Maximum Drawdown earns its keep.
Picture two investors earning nearly the same long-term return. One portfolio falls 12% during tough markets. The other loses 45% before it recovers. The final numbers might look similar, but living through those two scenarios feels nothing alike.
Watching almost half your money disappear isn’t something most people shrug off easily. Plenty panic, sell out, and end up missing the recovery that follows. Smaller drawdowns generally make it easier to stay invested when things get shaky.
That’s why experienced investors check drawdown before putting money in, rather than waiting until the losses show up on their statement.
What Does a Good Maximum Drawdown Look Like?
There’s no such thing as a perfect Maximum Drawdown number. What counts as reasonable depends on the strategy, the type of portfolio, and how much risk you can personally stomach.
A diversified large-cap portfolio, for instance, usually sees smaller drawdowns than one built entirely around small-cap stocks. Rather than hunting for the lowest drawdown possible, compare it against the returns the portfolio is actually generating.
Say two portfolios both deliver around 15% annual returns. If one never falls more than 12% while the other regularly drops 35%, most investors would feel a lot more at ease with the first.
The goal was never to dodge every fall. That’s simply not how the stock market works. The real goal is figuring out whether the downside risk is reasonable for the return you’re expecting in return.
Table 1: Comparing Two Portfolios
| Feature | Portfolio A | Portfolio B |
|---|---|---|
| Average Annual Return | 15% | 15% |
| Maximum Drawdown | 12% | 38% |
| Recovery Time | 5 Months | 18 Months |
| Investor Experience | Relatively Stable | More Volatile |
Looking only at returns makes both portfolios seem equally attractive. Looking at Maximum Drawdown shows the difference right away.
Why Returns Alone Can Be Misleading
Picture two friends setting out to climb the same mountain. One sticks to a well-marked trail and reaches the top without much trouble. The other takes a much steeper route full of loose rocks and risky sections.
Both make it to the summit. Most people would still pick the safer climb given the choice.
Investing works the same way. Returns tell you where the portfolio ended up. Maximum Drawdown tells you how hard it was to stay invested until it got there, and that extra bit of context often makes investment decisions a lot clearer.
Maximum Drawdown Is Only One Part of the Picture
Maximum Drawdown tells you the biggest fall a portfolio went through. It doesn’t explain why that fall happened, and it can’t tell you how often smaller dips occurred or how choppy the portfolio was on any given day.
Because of that, experienced investors rarely lean on Maximum Drawdown by itself. They usually pair it with other measures like the Sharpe Ratio, Sortino Ratio and overall volatility before drawing any conclusions. Looking at several risk measures side by side almost always beats relying on one number alone.

Rolling volatility charts add another layer to drawdown analysis, showing how choppy a portfolio has been across different stretches of time.
Common Mistakes While Using Maximum Drawdown
Maximum Drawdown tells an important part of the story, but never the whole story.
One common mistake is comparing completely different types of portfolios. Comparing a conservative large-cap portfolio against a high-risk small-cap one using only Maximum Drawdown doesn’t give you a fair fight. Both follow different styles and naturally carry different risk levels.
Another mistake is assuming the portfolio with the smallest drawdown must automatically be the better investment. A portfolio can post a lower drawdown simply because it’s taking less risk, which can also mean lower long-term returns. This is exactly why Maximum Drawdown should always be read alongside returns rather than on its own.
Investors also tend to forget that drawdown is built on historical data. It shows how a portfolio behaved in the past. It can’t predict how deep the next correction will actually be.
What Does an MDD Portfolio Tell You?
An MDD Portfolio is simply a portfolio that’s been analysed through the lens of Maximum Drawdown. Its whole purpose is to show the largest decline the portfolio faced before it recovered.
Imagine two portfolios generating nearly identical long-term returns. One recorded a Maximum Drawdown of 14%. The other went through a 32% decline. Most investors would naturally feel more at ease with the first, simply because the worst fall was so much smaller.
That doesn’t automatically make it the better investment though. It just helps investors gauge how much downside risk the portfolio has already been through during rough patches. Reading this number alongside returns gives a far clearer picture than looking at returns in isolation.
Table 2: Common Mistakes While Reading Maximum Drawdown
| Mistake | Why It Can Be Misleading |
|---|---|
| Looking only at drawdown | Returns should also be considered while comparing investments. |
| Comparing different portfolio types | Different strategies naturally carry different levels of risk. |
| Assuming history will repeat | Future market conditions may be very different. |
| Ignoring other risk measures | Maximum Drawdown explains only one aspect of investment risk. |
Maximum Drawdown Works Best with Other Risk Measures
No single metric can tell you everything about a portfolio. Maximum Drawdown shows the biggest fall. The Sharpe Ratio measures returns once you factor in overall volatility. The Sortino Ratio zeroes in only on downside risk. Each one is answering a slightly different question.
Think about picking a smartphone. Battery life matters. So does the camera. Software support, storage and display quality all shape the final call too. Looking at just one feature rarely tells you which phone actually deserves your money.
Investing runs on the same logic. Maximum Drawdown becomes a lot more useful once you weigh it alongside other risk measures instead of treating it as the final word.
Final Thoughts
Maximum Drawdown is one of the simplest ways to understand downside risk. It shows the biggest fall an investment went through before recovering, and it helps investors mentally prepare for the kind of declines they might face during rough markets.
Like any investment metric, Maximum Drawdown has its limits. It answers one important question well, but not every question. Returns, volatility and other risk-adjusted measures deserve just as much attention before you commit your money.
Instead of chasing the lowest drawdown you can find, check whether the level of risk actually matches the returns on offer. Looking at the full picture instead of leaning on a single number tends to lead to steadier, more balanced investment decisions.
Frequently Asked Questions
1. What is Maximum Drawdown?
Maximum Drawdown measures the largest percentage decline in a portfolio from its highest value to its lowest point before it recovers.
2. Why is Maximum Drawdown important?
It helps investors understand the biggest loss a portfolio has faced and gives a clearer picture of downside risk than returns alone.
3. How is Maximum Drawdown calculated?
It’s calculated by comparing the portfolio’s highest value with its lowest point before recovery and expressing that decline as a percentage.
4. What is an MDD Portfolio?
An MDD Portfolio is simply a portfolio analysed using Maximum Drawdown to understand its largest historical decline.
5. Should Maximum Drawdown be used alone?
No. It works best alongside other measures such as the Sharpe Ratio, Sortino Ratio and overall portfolio returns.