

Last Updated: July 2026
Picture three friends stopping at a momo stall after college. One orders veg steamed momos. Another goes for paneer. The third picks cheese corn.
All three ordered momos, but each chose a different filling because each one wanted a different experience.
Technical indicators work in a surprisingly similar way.
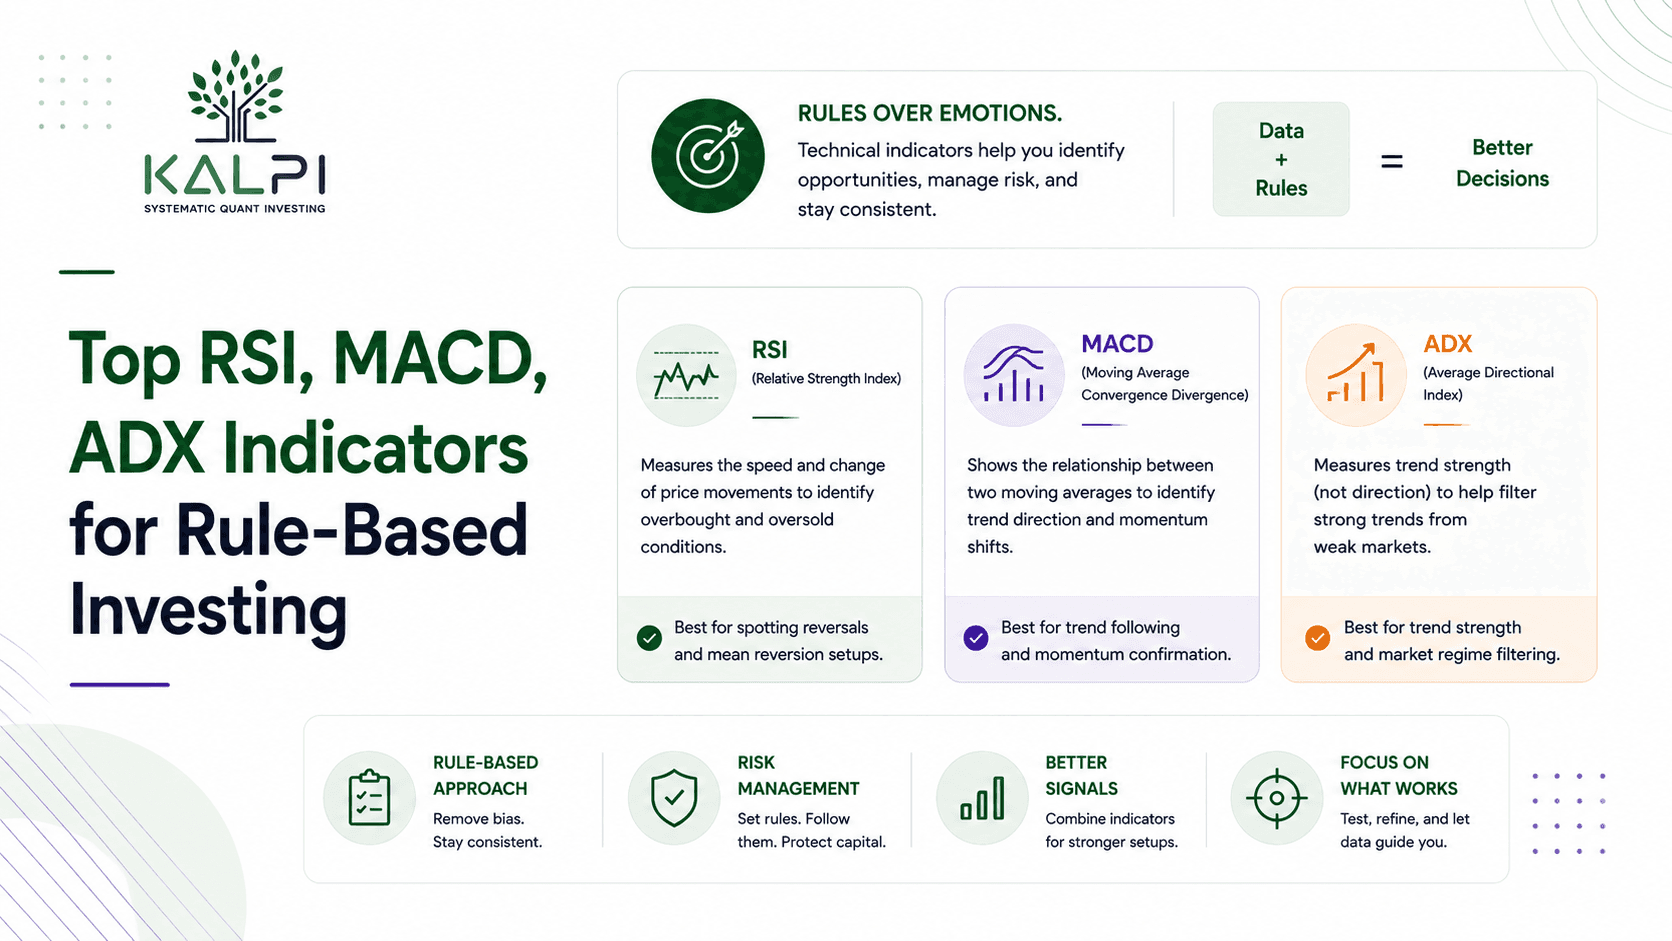
RSI, MACD and ADX all study price movements, but they are not answering the same question. RSI tells you whether a stock might be overbought or oversold. MACD looks at how momentum and trend direction are shifting. ADX, on the other hand, measures how strong a trend actually is.
None of these three is inherently better than the others. Each one is simply looking at price action from a different angle.
That is precisely why investors who follow rule-based investing rarely lean on a single indicator. They combine several technical filters instead, which helps take some of the emotion out of decision-making and keeps the process more disciplined.
This piece breaks down how RSI, MACD and ADX actually work, where each one shines, where each one falls short, and how investors use these tools together to build a reliable technical filters basket. If you are screening stocks or putting together India momentum indicators for a systematic strategy, understanding these three can make your process a lot more consistent.
What Is Rule-Based Investing?
A lot of investors buy or sell based on emotion. They get excited when markets are running hot and panic the moment prices fall. Over time, that pattern tends to produce inconsistent results.
Rule-based investing takes a different route.
Instead of reacting to news headlines or market rumours, investors set a fixed list of rules before they put money to work. A simple version might look like this:
- Buy only when RSI moves above a certain level
- Confirm the signal using MACD
- Enter the trade only if ADX shows a strong trend
- Exit once the predefined stop-loss or target is hit
Every decision runs through the same filter. That consistency is a big part of why professional traders and quant investors trust rule-based systems over gut feel.
No system wins every trade, of course. The goal was never to predict every market move perfectly. It is to strip out unnecessary emotion and improve decision-making over the long run.
Why Technical Indicators Matter
Stock prices move every single day. Some of that movement comes from genuine business performance, and some of it is just sentiment, global news or short-term trading activity.
Staring only at a price chart can make it hard to tell which is which. Technical indicators help organise that noise.
Rather than guessing whether a trend is getting stronger or fading, investors use indicators to measure momentum, trend strength and possible turning points.
Think about driving a car. A driver does not rely on the road alone. They glance at the speedometer, the fuel gauge and the mirrors too, because each one tells them something different.
Technical indicators serve a similar purpose. RSI, MACD and ADX do not replace price action. They add extra layers of information that help investors make a more informed call, which is why many consider them among the best technical indicators for building a disciplined process.
Understanding RSI (Relative Strength Index)
The Relative Strength Index, or RSI, is one of the most widely used momentum indicators in technical analysis.
It measures how fast and how strongly prices have been moving recently. RSI is not telling you whether a company is fundamentally sound. It is simply flagging whether buying or selling activity has become unusually intense over a short window.
The indicator moves between 0 and 100. As a general rule:
- An RSI above 70 suggests the stock may be overbought
- An RSI below 30 suggests the stock may be oversold
These levels are not automatic buy or sell triggers. They are more of a nudge to study the stock a bit more closely before acting.

Take a quality company whose share price has climbed fast over a few weeks. Its RSI might push past 70 simply because buying momentum has been unusually strong. That does not mean the stock is about to fall the next morning. Strong companies can stay overbought for a long stretch during powerful bull runs.
The same logic applies in reverse. An RSI below 30 does not guarantee a quick bounce back. Weak companies can keep sliding even after looking oversold.
This is exactly why experienced investors treat RSI as one input among several, rather than a signal to act on by itself.
Why Investors Like RSI
RSI remains one of the most popular India momentum indicators for a few practical reasons.
- Simple to understand: even beginners can pick up how RSI works without needing advanced maths
- Useful for spotting momentum extremes: it flags when buying or selling pressure has stretched too far
- Works across markets: RSI applies to stocks, indices, ETFs and most other financial instruments
- Easy to pair with other tools: many investors use it alongside MACD or ADX instead of relying on it alone
Where RSI Has Its Limitations
RSI is useful, but far from perfect.
One common beginner mistake is assuming every overbought reading calls for an immediate sell. Markets rarely cooperate that neatly. During strong bull runs, RSI can sit above 70 for weeks while the stock keeps climbing. During long declines, it can stay below 30 even as the price keeps falling.
RSI also focuses mostly on momentum. It does not tell you whether the underlying trend itself is strong or weak, which is exactly where the next indicator earns its place.
Many rule-based investors pair RSI with an extra confirmation tool before acting on any signal. Doing so cuts down on false alarms and builds a more balanced technical filters basket.
RSI gives useful momentum information, but momentum alone will not tell you whether a new trend is just beginning or already losing steam.
Understanding MACD (Moving Average Convergence Divergence)
A stock can look overbought on RSI and still keep climbing for weeks. Another can look oversold and keep falling. That gap is exactly why many investors reach for a second opinion, and MACD is one of the most popular choices.
The Moving Average Convergence Divergence, better known as MACD, helps investors see whether momentum is strengthening, weakening or beginning to change direction. Instead of asking whether a stock has moved too far, MACD asks whether the underlying trend itself might be shifting.
MACD is built on moving averages, but you do not need to work through the maths yourself. Most charting platforms calculate it for you. What matters is knowing how to read the signal, not memorising the formula.
How MACD Works
MACD has three parts:
- The MACD Line
- The Signal Line
- The Histogram
The signal investors watch most closely is the crossover between the MACD Line and the Signal Line.
When the MACD Line moves above the Signal Line, it can suggest bullish momentum is building. When it slips below, it can point to growing selling pressure.
The Histogram adds one more layer. As the gap between the two lines widens, momentum is generally getting stronger. As that gap shrinks, it can be a sign the current trend is running out of steam.
Rather than reacting to every small wiggle in price, MACD nudges investors to focus on the bigger picture.

Why Many Investors Use MACD
MACD has stayed popular for years because it tells you something RSI alone cannot. RSI might say momentum has become strong, but MACD helps you judge whether that momentum is actually shaping into a meaningful trend.
It also smooths out a lot of the short-term price noise that tends to distract investors. Instead of reacting to every daily wobble, it highlights the bigger shifts happening underneath.
MACD works across different time frames too. Whether you are looking at daily, weekly or monthly charts, the same principles apply, which is part of why it remains one of the best technical indicators for traders and long-term investors alike.
Where MACD Can Mislead Investors
No indicator gets it right every time, and MACD is no exception.
Because it is built on moving averages, it reacts after prices have already started moving. By the time a crossover shows up, part of the move may already be behind you.
Sideways markets are another weak spot. If a stock keeps churning within a narrow range, MACD can throw up several crossovers that never turn into a real trend. Investors who act on every one of these signals often end up making trades they did not need to make.
This is why experienced investors rarely lean on MACD in isolation. They usually wait for price action or another indicator to back it up first.
RSI vs MACD: Do You Really Need Both?
Beginners often treat RSI and MACD as if they do the same job. They do not.
RSI measures momentum and flags when buying or selling pressure has stretched unusually far. MACD, meanwhile, tracks how trend and momentum are changing over time.
In plain terms, RSI is answering “Has the price moved too far?” while MACD is answering “Is the trend starting to change?”
That difference is exactly why plenty of rule-based strategies use both indicators rather than picking just one.
| Feature | RSI | MACD |
|---|---|---|
| Primary Purpose | Measures momentum | Identifies changes in trend and momentum |
| Common Use | Spotting overbought or oversold conditions | Confirming trend direction |
| Strongest In | Ranging or mildly trending markets | Trending markets |
| Best Used With | Trend confirmation indicators | Momentum indicators like RSI |
Why Investors Combine RSI and MACD
Think back to those three friends at the momo stall. All of them ordered momos, but each picked a different filling based on what they wanted that day.
RSI and MACD work the same way. Both study price movement, but each one is highlighting something different.
Say RSI moves above 60 after a few weeks of steady buying, and MACD flashes a bullish crossover at the same time. Neither signal guarantees prices will keep rising. But when both point the same direction, most investors feel a lot more confident acting on it than they would relying on just one reading.
This is part of why experienced investors often stack multiple India momentum indicators while building a technical filters basket, letting different signals confirm one another before they act.
Understanding ADX (Average Directional Index)
RSI measures momentum. MACD flags changes in trend. There is still one question left unanswered though. How strong is the trend, really?
That is exactly what the Average Directional Index, or ADX, is built to measure.
Unlike RSI or MACD, ADX will not tell you whether a stock is heading up or down. It only measures how strong the current trend is, regardless of which direction it is pointing.
Think about riding a bicycle. You care less about whether the road goes uphill or downhill and more about whether the surface is smooth enough to keep moving comfortably. ADX works on a similar idea. It cares about the strength of the move, not its direction.
The indicator typically runs from 0 to 100. As a general guide:
- An ADX below 20 often points to a weak or sideways market
- An ADX above 25 suggests a stronger trend may be forming
Higher readings usually mean stronger trends, but these numbers are guidelines rather than fixed rules. Different investors set slightly different thresholds depending on their own strategy.

Why Investors Use ADX
ADX has earned its place among the more useful India momentum indicators because it helps investors steer clear of markets that lack a clear direction.
- Measures trend strength: instead of guessing whether a move has real momentum behind it, ADX gives an objective read
- Helps filter weak setups: many indicators throw up signals during sideways markets, and checking ADX first can help you skip trades where the trend is simply too weak
- Works well alongside other indicators: ADX is rarely used solo. It becomes far more useful once paired with RSI and MACD as part of a disciplined technical filters basket
Where ADX Has Its Limitations
ADX has its blind spots too.
A common mix-up is assuming a high ADX automatically means a stock is worth buying. It does not. A strong downtrend can just as easily push ADX higher, because the indicator measures the strength of a trend, not which way it is going.
It also reacts to price movement instead of predicting it. By the time ADX confirms a strong trend, a chunk of the move may already have played out.
That is why experienced investors rarely use ADX by itself. They pair it with tools that measure momentum and direction before deciding anything.
RSI vs MACD vs ADX: Which Indicator Is Better?
One question beginners ask constantly is which of the three they should actually use.
The honest answer is none of them wins outright. Each one is built to answer a different question about the market.
| Indicator | Primary Purpose | Best Used For |
|---|---|---|
| RSI | Measures momentum | Identifying possible overbought or oversold conditions |
| MACD | Identifies trend changes | Spotting shifts in momentum and trend direction |
| ADX | Measures trend strength | Confirming whether a trend is strong enough |
Back to the momo stall. All three friends ordered momos, but one went veg steamed, another paneer, and the third cheese corn, simply because each wanted something different.
RSI, MACD and ADX follow the same logic. All three study price movement, but each is looking at a different slice of the picture. That is why seasoned investors rarely bet everything on one of them. Combining the three tends to build a more reliable and disciplined process.
Building a Simple Rule-Based Strategy
A rule-based strategy does not need to be complicated. Many investors run through a straightforward checklist every single time:
- Look for stocks where RSI is improving rather than staying weak
- Check whether MACD confirms positive momentum
- Verify ADX shows a sufficiently strong trend
- Enter the trade only once all conditions line up
- Decide the exit level before entering the position
This will not eliminate losing trades. No strategy can promise that. Its real strength lies in consistency, since every decision follows a predefined rule instead of shifting with mood or the day’s headlines.
Common Mistakes Investors Make
Even the best technical indicators can produce poor results when used carelessly. Some of the more common slip-ups:
- Depending on only one indicator
- Treating every RSI reading above 70 as an automatic sell
- Ignoring the broader market trend
- Taking trades without proper risk management
- Changing the rules after just a few losing trades
A rule-based strategy that actually works is built on discipline, patience and consistency, not on constantly rewriting the rules whenever things go wrong.
Final Thoughts
RSI, MACD and ADX have stuck around for years because each one offers a different lens on market behaviour.
RSI flags momentum extremes. MACD picks up changes in trend direction. ADX tells you whether that trend actually has enough strength to matter.
On their own, each comes with real strengths and real limitations. Put together, they form a practical technical filters basket that helps investors make steadier decisions.
Rule-based investing was never about predicting every market move correctly. It is about building a repeatable process that takes emotion out of the equation and rewards discipline over time.
As you get more comfortable, you can fine-tune your own rules, test different combinations, and shape a strategy that actually fits how you invest and how much risk you are willing to carry.
Frequently Asked Questions
Which is better: RSI, MACD or ADX?
None is universally better. RSI measures momentum, MACD identifies trend changes and ADX measures trend strength. Many investors combine all three for stronger confirmation.
Can beginners use RSI, MACD and ADX?
Yes. These indicators are beginner-friendly and available on most charting platforms. That said, they should always be paired with proper risk management rather than used in isolation.
Is RSI enough for rule-based investing?
Not usually. RSI gives useful momentum information, but combining it with MACD and ADX typically offers stronger confirmation before acting on a trade.
What is the best technical indicator for trend confirmation?
ADX is widely used to measure trend strength, while MACD helps spot changes in trend direction. Used together, they provide more reliable confirmation than either one alone.
Can technical indicators guarantee profitable trades?
No. Technical indicators improve decision-making, but they cannot guarantee profits. Long-term success also depends on discipline, risk management and sticking to a consistent process.