

Last Updated: July 2026
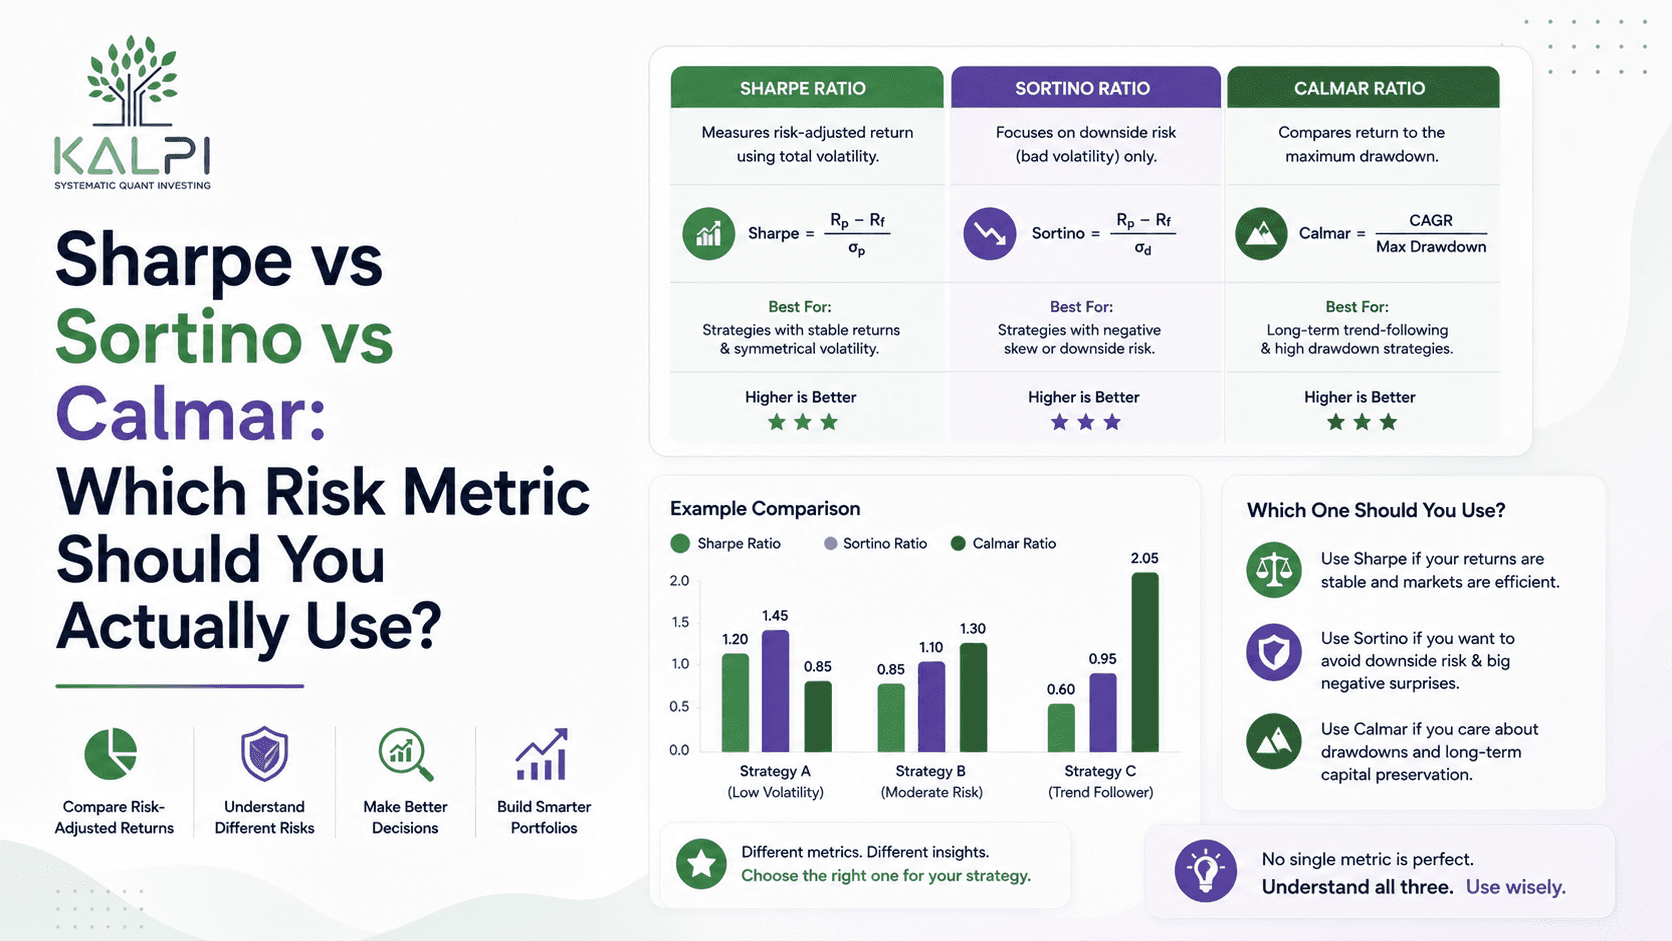
Choosing between Sortino ratio vs Sharpe depends on what you actually want to measure. The Sharpe Ratio checks returns against total risk, while the Sortino Ratio looks only at downside risk. The Calmar Ratio compares returns with the biggest fall a portfolio has taken. Rather than hunting for one best metric, investors should figure out when each risk-adjusted return metric gives the most useful answer.
Why Looking Only at Returns Can Be Misleading
Say you order groceries through Zepto on two different weekends. Both orders arrive within an average of 10 minutes. The first delivery reaches you in exactly 10 minutes every single time. The second one is all over the place, five minutes one day, twenty-five the next, and sometimes later than that.
Both average out the same. Yet most people would trust the first service more, simply because it does not surprise them.
Investing works on a similar logic. Two strategies can end up with the same return, but the ride to get there looks nothing alike. One portfolio grows steadily with only minor bumps. Another swings sharply up and down before landing at a similar number anyway.
Looking only at the final return hides a big chunk of that story. Experienced investors check both returns and risk before comparing anything, and the Sharpe Ratio, Sortino Ratio and Calmar Ratio exist for exactly this reason. Instead of asking only how much money a portfolio made, they ask something just as important. How much risk did the investor take on to earn that return?
Getting a handle on Sortino ratio vs Sharpe is usually the first step before figuring out whether the Calmar Ratio adds anything extra to the picture.
Why Returns Alone Never Tell the Full Story
Plenty of beginners compare investments using nothing but annual returns. Say Portfolio A returned 18% last year while Portfolio B returned 16%. At first glance, Portfolio A looks like the clear winner.
Now look a little closer. During the year, Portfolio A went through several sharp drops, falling nearly 25% at one point before it recovered. Portfolio B returned slightly less, but it moved far more steadily, without any major fall along the way.
Some investors would still pick Portfolio A for the higher number. Others would go with Portfolio B because the ride felt smoother. Neither choice is automatically right, and it really comes down to how much uncertainty you can sit through without losing sleep.
Professional investors rarely compare returns without also weighing risk alongside them, because a risk-adjusted return metric tells you whether that extra return was actually worth the risk taken to get it.
What Is a Risk-Adjusted Return Metric?
A risk-adjusted return metric compares what an investment earned with how much risk it took to earn it. Instead of asking only how much money a portfolio made, it also looks at how bumpy the journey was.
Picture two people travelling from Delhi to Jaipur. One drives on a smooth highway with barely any traffic. The other reaches around the same time but has to deal with traffic jams, road diversions and heavy rain the entire way. Both travellers arrive, sure, but one clearly had an easier trip.
Investments behave in much the same way. Two portfolios can generate similar returns, yet one may go through far bigger price swings than the other. Risk-adjusted return metrics help investors spot that difference instead of judging everything by the final number, and that is precisely why they show up so often while analysing mutual funds, stock baskets and investment strategies.
What Is the Sharpe Ratio?
The Sharpe Ratio is one of the most widely used measures of risk-adjusted performance. Its job is simple. It measures how much extra return an investment generates for every unit of total risk taken.
In plain words, it answers a practical question. Was the extra return worth all the ups and downs? The Sharpe Ratio treats every kind of price movement as risk, whether prices swing sharply up or sharply down, both get counted while measuring overall volatility.
Because of this, the Sharpe Ratio works well when you want to understand a portfolio’s overall consistency rather than focus purely on its losses. It gets used a lot while comparing mutual funds, ETFs, stock baskets and professionally managed portfolios.
A higher Sharpe Ratio generally suggests an investment earned better returns for the risk it took on, but the number should never be judged in isolation. It only becomes meaningful once you compare it against similar investments following comparable strategies.
Which Sharpe Ratio Is Good?
This is one of the most common questions investors ask, and there is no single number that guarantees an investment is good. The Sharpe Ratio works best as a comparison tool. As a rough guide:
| Sharpe Ratio | General Interpretation |
|---|---|
| Below 1 | Lower risk-adjusted performance |
| Around 1 | Reasonable performance |
| Above 2 | Strong risk-adjusted performance |
| Above 3 | Rare and generally considered excellent |
Treat these values as broad guidelines, not fixed rules. A higher Sharpe Ratio does not automatically mean one investment beats another, because different strategies naturally carry different levels of risk. You would not judge a conservative debt fund and a high-growth small-cap portfolio by the same yardstick.
The Sharpe Ratio becomes far more useful when you compare investments within the same category. Looking at the number without understanding the strategy behind it can easily point you to the wrong conclusion.
It is a solid starting point, but it does not answer every question about risk. It treats every price move the same way, whether prices go up or down, and many investors do not see rising prices as a problem at all, since that is exactly how wealth grows. So should positive and negative movements really carry equal weight? That question is what led to another widely used measure, the Sortino Ratio, which looks only at downside risk.

A correlation matrix like this shows how different risk factors move together, which is the same kind of thinking behind separating total risk from downside risk.
What Is the Sortino Ratio?
The Sharpe Ratio measures every type of price movement as risk. The Sortino Ratio looks at risk differently. Instead of treating every fluctuation the same way, it focuses only on the moves investors actually worry about: losses, or downside volatility.
Think about ordering dinner through Swiggy. Sometimes your food shows up five minutes early. Other days it arrives right on time. Occasionally, it turns up much later than promised. Which of these actually annoys you? Nobody complains about food arriving early. The frustration is always the delay.
The Sortino Ratio runs on that same logic. A pleasant surprise is not treated as a problem, only the downside that can actually hurt an investor gets measured. Many investors lean on the Sortino Ratio for exactly this reason while analysing portfolios that see frequent upward moves but only occasional losses.
Sortino Ratio vs Sharpe
The conversation around Sortino ratio vs Sharpe often gets confusing because both measure risk-adjusted returns. Their goal is similar. How they measure risk is not.
The Sharpe Ratio includes every price movement. The Sortino Ratio only considers the downside. Say two portfolios both generate a 15% return. The first bounces up and down all year before finishing at 15%, while the second mostly climbs upward with just a handful of small dips.
The Sharpe Ratio may penalise both portfolios equally for their overall volatility. The Sortino Ratio, on the other hand, gives more weight to the losses investors actually felt. For anyone mainly focused on protecting their capital, that difference matters quite a bit. Neither ratio wins outright. Each one is simply answering a different question.
Table 1: Sortino Ratio vs Sharpe
| Feature | Sharpe Ratio | Sortino Ratio |
|---|---|---|
| Measures | Return compared with total risk | Return compared with downside risk |
| Counts upward movement as risk | Yes | No |
| Counts downward movement as risk | Yes | Yes |
| Best used when | Comparing overall portfolio stability | Evaluating downside protection |
| Common users | Mutual funds, ETFs, diversified portfolios | Growth portfolios, active strategies |
Why Investors Sometimes Prefer the Sortino Ratio
Most investments go through regular price swings, some positive, some negative. The Sharpe Ratio treats both the same way, and plenty of investors feel that approach misses part of the picture.
If a portfolio rises more than expected, most people take that as good news. Concern usually kicks in only once prices start falling, and that gap is basically why the Sortino Ratio has picked up so much popularity over the years. It puts the spotlight on the part of volatility that actually affects investors, financially and emotionally both. For strategies that naturally see bigger upward swings, the Sortino Ratio can paint a clearer picture than the Sharpe Ratio ever will.
Which Metric Should You Trust?
There is no universal winner here. It depends entirely on what you are trying to understand.
If you want to check how consistently a portfolio performed while accounting for every price move, the Sharpe Ratio is usually a good place to start. If your biggest worry is protecting your portfolio from losses, the Sortino Ratio often gives you a sharper view.
Experienced investors rarely lean on just one metric before making a call. They compare a few risk measures side by side, because multiple numbers together almost always give a more balanced read than a single figure ever could.
Picture two people driving from Mumbai to Pune, both arriving in exactly three hours. The first driver keeps a steady pace the whole way. The second speeds up suddenly, brakes hard, accelerates again, and repeats that pattern several times before arriving at the same moment. Both completed the trip, but one ride was clearly smoother. Portfolios work no differently. Two of them can produce similar returns while exposing investors to very different amounts of uncertainty along the way, and risk-adjusted return metrics exist to measure exactly that gap instead of judging things purely by where the journey ended.
When the Sharpe and Sortino Ratios Still Are Not Enough
Both ratios offer useful information, but neither tells the whole story. Both are mainly built around volatility. Neither measures the single biggest fall an investor had to sit through before the portfolio recovered, and for a lot of investors, that one number matters just as much as the day-to-day noise.
A portfolio can have a great Sharpe Ratio. It can have a great Sortino Ratio too. And it could still go through one brutal decline during a market crash. Another measure earns its place here, one that skips regular volatility and looks instead at the relationship between returns and a portfolio’s largest decline. This is the Calmar Ratio.
The Calmar Ratio adds one more layer by showing how a strategy handled its worst stretch. Looking at all three metrics together usually paints a far more complete picture than relying on just one.
What Is the Calmar Ratio?
Say you order food from Zomato every weekend. Most deliveries arrive right on time. One day, though, your order is delayed by almost an hour because of heavy traffic. Every other delivery went smoothly, but that one bad experience is what sticks in your memory.
Investing can feel exactly like that. Small ups and downs are part of every portfolio, but a big fall is usually what investors remember most. The Calmar Ratio is built to answer that specific question. Rather than measuring day-to-day volatility, it compares a portfolio’s return with its maximum drawdown, the largest drop in value before the portfolio bounced back.
For anyone who wants to know how a strategy held up during its toughest stretch, the Calmar Ratio offers an angle that the other two ratios do not quite capture.

Checking asset correlations for concentration risk is another way of asking how deep a portfolio’s worst-case drawdown could actually go, which is exactly what the Calmar Ratio measures.
Sharpe vs Sortino vs Calmar
Each metric measures risk in its own way, which is why there is no single answer to which one is the best. The right choice depends on what you are trying to understand.
The Sharpe Ratio looks at total volatility. The Sortino Ratio focuses only on downside volatility. The Calmar Ratio compares returns with a portfolio’s largest decline. None of these replace the others, each highlights a different slice of the risk picture, and looking at all three together usually gives you a much clearer read on a strategy.
Table 2: Sharpe vs Sortino vs Calmar
| Metric | Measures | Best Used For |
|---|---|---|
| Sharpe Ratio | Return compared with total volatility | Comparing overall portfolio efficiency |
| Sortino Ratio | Return compared with downside volatility | Investors mainly concerned about losses |
| Calmar Ratio | Return compared with maximum drawdown | Understanding performance during major market declines |
Which Risk Metric Should You Actually Use?
Many beginners spend far too much time hunting for the best ratio. A better question to ask is whether the metric actually matches what you want to measure.
If you are comparing diversified portfolios with similar investment styles, the Sharpe Ratio is usually a solid place to start. If your main worry is protecting your portfolio from losses, the Sortino Ratio often gives a better read since it ignores positive volatility altogether. And if you want to know how deep a portfolio has fallen during rough market conditions, the Calmar Ratio deserves your attention too.
Looking at just one number can leave out important context. Using all three together gives you a far more balanced picture of both returns and risk.
Common Mistakes While Comparing Risk Metrics
These ratios are genuinely useful, but they should never be treated as the final word.
One common mistake is comparing portfolios that follow completely different strategies. Comparing a conservative debt fund with a small-cap growth portfolio using just one ratio can easily lead you astray.
Another mistake is chasing the highest number. A higher ratio does not automatically mean a better investment, so always weigh the portfolio’s objective, investment style, time horizon and risk level before drawing comparisons.
Worth remembering too: these ratios are built on historical data. They explain how a strategy behaved in the past, and they cannot promise the same results going forward.
Looking Beyond the Numbers
Risk metrics make comparison easier, but they should support your decision, not make it for you.
A portfolio with an excellent Sharpe Ratio can still struggle during a severe market correction. A strong Sortino Ratio may not reveal just how painful the biggest decline actually felt. The Calmar Ratio can flag that decline, but it cannot tell you why it happened.
Experienced investors also look at business quality, diversification and long-term goals before making a call. The numbers matter, but they should never be the only reason behind an investment decision.
Final Thoughts
The debate around Sortino ratio vs Sharpe is not about finding one metric that works in every situation. Each ratio measures a different slice of investment risk.
The Sharpe Ratio checks returns against total volatility. The Sortino Ratio focuses on downside risk. The Calmar Ratio compares returns with a portfolio’s maximum drawdown. Put together, they give you a far clearer picture than any single metric could on its own.
If someone asks which Sharpe ratio is good, the better answer is to compare it against similar portfolios instead of judging the number in isolation. No risk-adjusted return metric can tell you what markets will do next. These are tools that help you compare strategies more effectively, not predict future returns.
The strongest investment decisions usually come from combining these measures with patience, diversification and a disciplined process.
Frequently Asked Questions
1. What is the difference between the Sharpe Ratio, Sortino Ratio and Calmar Ratio?
The Sharpe Ratio measures return against total volatility, the Sortino Ratio focuses only on downside volatility, and the Calmar Ratio compares return with the portfolio’s maximum drawdown.
2. Which Sharpe Ratio is considered good?
As a general guide, a Sharpe Ratio above 1 is considered reasonable, above 2 is strong and above 3 is excellent. It should always be compared with similar investment strategies though.
3. Is the Sortino Ratio better than the Sharpe Ratio?
Not always. The Sortino Ratio is more useful when downside risk is your main concern, while the Sharpe Ratio gives a broader view of overall portfolio volatility.
4. When should investors use the Calmar Ratio?
The Calmar Ratio is useful when investors want to understand how a portfolio performed during its biggest decline and how well it recovered from that period.
5. Should investors rely on only one risk-adjusted return metric?
No. Looking at the Sharpe Ratio, Sortino Ratio and Calmar Ratio together usually gives a more complete understanding of a portfolio’s performance and risk.