

Most people pick funds based on their returns. Here’s the part that the number doesn’t tell you.
Arjun and Meera both started SIPs in 2023. Same amount ₹10,000 a month. Neither of them had invested before.
Arjun went with a small-cap fund. His colleague had been talking about it for weeks. The 3-year CAGR was 34%. The numbers looked incredible. He didn’t ask many questions.
Meera spent a few evenings going through different options before she picked anything. She ended up with a flexicap fund. 16% CAGR. Her cousin thought she was leaving money on the table.
By mid-2024, Arjun’s fund had fallen nearly 40% from its peak. His ₹10,000 every month felt like it was vanishing. He stopped the SIP in March. Started again in August when things looked better. Stopped again in December when they didn’t.
Meera’s fund had dipped 13% at its worst. She noticed, felt mildly uncomfortable for a week, and kept going.
Three years later, on paper, both funds showed similar returns. But Arjun had stopped and restarted twice, missed two recoveries, and was still trying to figure out where he went wrong. Meera had simply stayed.
This is not a story about discipline. Arjun isn’t undisciplined. He was just on a much wilder ride than Meera and nobody had told him that before he started.
Two Boards. Same Game. Very Different Experience.
Think about Snakes and Ladders for a second.
There are two versions of the board. Version A has massive snakes and massive ladders one unlucky roll sends you from square 78 all the way back to square 6. One lucky roll launches you from square 3 straight to square 94. Huge swings. The game can end in 15 minutes or take two hours. Nobody really knows.
Version B is quieter. Smaller snakes, shorter ladders. The board doesn’t swing wildly. You make progress, you face setbacks, but nothing dramatic enough to make you want to tip the board over and leave.
Now here’s the thing if both boards have the same average finishing time, which one do you pick when you actually need to be somewhere after?
Version B. Every time. Because predictability has real value when something is on the line.
Arjun’s fund was a Version A board. Meera’s was closer to Version B. Their CAGR numbers looked similar at the end. But the boards were nothing alike. And that difference between how much reward you got per unit of chaos you absorbed is exactly what the Sharpe ratio is measuring.
What the Sharpe Ratio Actually Tells You
The Sharpe ratio is a number that answers one specific question: how much return did you get for the risk you took on?
Not just the return. The return relative to the wildness of the board.
A high Sharpe ratio means you were rewarded well for the volatility you absorbed. A low one means the board was chaotic, and the return barely justified it. A negative Sharpe ratio means you’d have been better off in an FD you played a wild game and still lost to the safest option on the table.
The Sharpe Ratio Formula Simpler Than It Sounds
The Sharpe ratio formula is:
Sharpe Ratio = (Your Return − Risk-Free Rate) ÷ Standard Deviation
Three parts. None of them complicated.
Your return what the investment gave you over the period. Say 18%.
Risk-free rate what you’d have earned without taking any risk. An FD, a government bond. In India, roughly 6.5 to 7%. This is the baseline. If you absorbed all that volatility and only beat your FD by 1%, the math will show that clearly.
Standard deviation the board’s wildness score. How much did your returns jump around? A fund that gave 3% one quarter, then 29%, then −17% has a high standard deviation. A fund that returned 10%, 12%, 11% has a low standard deviation. The wilder the ride, the bigger the number.
Together, the formula asks: after accounting for what I could’ve earned safely, how much extra return did I get for every point of wildness I absorbed?
Arjun and Meera the actual numbers
Let’s put actual numbers on their funds.
Arjun’s fund 18% return, risk-free rate 6.5%, standard deviation 22%
(18 − 6.5) ÷ 22 = 0.52
Meera’s fund 16% return, same risk-free rate, standard deviation 9%
(16 − 6.5) ÷ 9 = 1.06
Meera’s fund gave less return. But her Sharpe ratio was double Arjun’s. For every point of volatility she absorbed, she got twice the reward. His board was twice as wild and the extra 2% return didn’t come close to covering that.
Rough guide above 1 is decent, above 1.5 is good, below 0.5 means the chaos wasn’t worth it. Not rules, just a starting point for comparison.
Why CAGR Alone Is an Incomplete Picture
CAGR is the number every platform leads with. Every fund advertisement, every app homepage, every WhatsApp forward from that one uncle who got into investing in 2020 it’s always the CAGR in large font and the risk details somewhere much smaller.
It’s a useful number. If you want to know how much your money compounded over five years, CAGR tells you that cleanly.
What it doesn’t tell you is anything about the journey.
Two funds, identical 17% CAGR over five years. One of them crashed 44% in year two before recovering. The other never fell more than 11%. Same finishing square. The CAGR is identical. The boards were nothing alike.
The problem is that a 40% drop isn’t just a number on a screen. When your ₹5 lakh is showing ₹3 lakh on a Tuesday morning, the theory about staying invested stops feeling like wisdom and starts feeling like denial. People stop SIPs. People sell. They wait for things to feel safer which usually means they’ve missed most of the recovery by the time they get back in.
Arjun didn’t make a bad decision in a vacuum. He made a very human decision on a very wild board. The CAGR never warned him about the board.
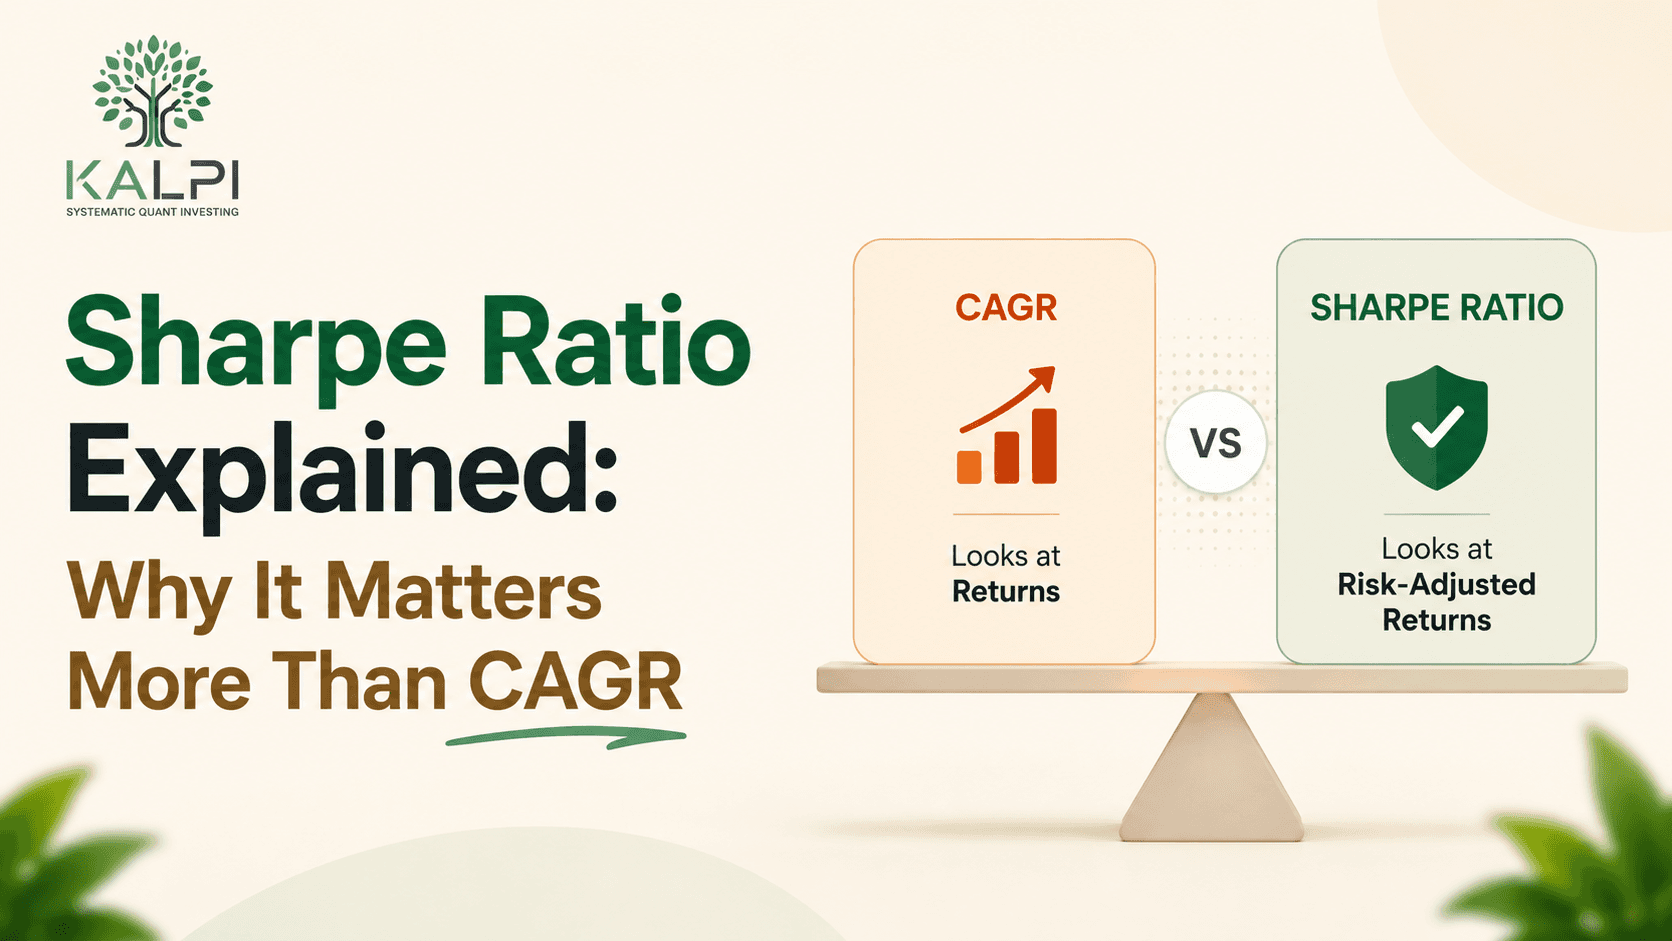
CAGR tells you the finishing square. The Sharpe ratio tells you what kind of game you were actually playing to get there.
Sharpe ratio vs CAGR side by side
| CAGR | Sharpe Ratio | |
|---|---|---|
| What it shows | Where you finished | How wild the journey was |
| Accounts for risk | No | Yes , that’s the whole point |
| Two funds, same number | Looks identical | Shows which board was calmer |
| Best used for | Tracking growth over time | Comparing two similar funds fairly |
| Blind spot | Everything in between | Needs 3+ years to be meaningful |
Why Risk Adjusted Return Is What Actually Matters
Here’s something worth saying plainly most investors in India don’t lose money because they picked fraudulent schemes. They lose because they picked funds they couldn’t emotionally hold through a bad stretch.
Arjun’s fund was fine. It recovered. He just wasn’t in it for the recovery because the drawdown was more than he could sit with. That’s not a character flaw. That’s what happens when someone is put on a Version A board without knowing what they signed up for.
A fund with a high Sharpe ratio gives you a smoother ride. The drops still happen no fund is immune to a falling market. But when the drops are smaller, you’re more likely to stay. And staying is the entire game with compounding.
Ten years of staying in a 13% fund beats ten years of starting and stopping a 19% fund. Not because of the math the math would favour the 19% fund. But because real investors don’t behave like the math assumes they will.
Same returns. Very different boards.
Here’s what this looks like in practice three funds, same general time period:
| Fund Type | CAGR | Volatility | Sharpe Ratio | The board it is |
|---|---|---|---|---|
| Aggressive smallcap | 21% | Very high | 0.5 | Giant snakes, giant ladders most people can’t hold it |
| Mid-return flexicap | 17% | Moderate | 1.1 | Reasonable swings fair reward for the ride |
| Steady largecap blend | 13% | Low | 1.7 | Calmer board you’ll probably actually stay |
The first fund looks best on paper. The Sharpe ratio is asking whether you’ll actually still be holding it when the recovery happens or whether the board will shake you off first.
Where Beginners Usually Go Wrong
A few things that come up repeatedly with new investors:
Chasing last year’s top fund
A fund that returned 45% in a bull year was riding enormous ladders. The same fund has enormous snakes. High returns in a good market tell you almost nothing about whether the fund is actually good.
Comparing funds across different categories
A small-cap and a large-cap are different games on completely different boards. Comparing their Sharpe ratios only makes sense within the same category otherwise, the comparison tells you nothing useful.
Thinking SIP is a fix for everything
SIPs are excellent for averaging your entry price. They don’t change the board. A wild fund with a SIP is still a wild fund you’re just landing on it more frequently.
Using data from too short a period
Six months of Sharpe ratio data means almost nothing. You need at least three years, ideally including a real correction. A calm board in a bull run might just be one where the big snakes haven’t appeared yet.
How Kalpi Fits Into This
After Arjun stopped his SIP the second time, he spent a few days on Kalpi going through what had actually happened. Not just the return but the full picture. The drawdown history. How much the fund had swung month to month. What the Sharpe ratio looked like compared to other funds in the same category.
He said later that seeing the standard deviation sitting right next to the CAGR changed how he read the numbers. The fund he’d been in had a Sharpe ratio of 0.48. The one he eventually switched to had 1.1. Same category. The return difference was a few percentage points. The board difference was significant.
This is what Kalpi is built around not just showing you what a fund returned, but helping you understand what kind of ride that return came with. The Sharpe ratio, the drawdown data, the risk adjusted return it’s all there alongside the headline number, because the headline number alone has already cost a lot of people a lot of money.
When you’re deciding between two funds, you deserve to know what board you’re sitting down at. Not just what the last few years looked like in the best possible framing.
What Happened to Arjun and Meera
Arjun is still investing. He restarted properly about eight months ago different fund, calmer board. He checks it less. He says the experience feels different when a 10% dip doesn’t feel like the floor is falling out.
Meera added to her SIP last quarter. When asked how she feels about the portfolio, she said it’s kind of boring to track. That’s probably the best thing she could have said.
The next correction is coming. Markets always correct. The question that actually determines long-term outcomes isn’t which fund has the best CAGR right now it’s which board you can stay on when things get uncomfortable.
Arjun finally understood what Meera had worked out without even trying to the goal was never to find the board with the biggest ladders. It was to find the one he wouldn’t abandon when the snake showed up.
Two portfolios can deliver similar returns while taking completely different levels of risk and a high return number alone will never show you that. The CAGR looks clean, the marketing looks convincing, and the wildness of the board stays hidden until a correction arrives. That’s exactly why metrics like the **Sharpe ratio** matter: they help you see whether those returns were actually efficient or just aggressively risky.
If you want to see this in practice actual strategies with their risk-adjusted return data, drawdowns, and Sharpe ratios laid out clearly explore Kalpi’s rule-based investing strategies. It’s a good place to see what a calmer board actually looks like before you commit to one.
Frequently Asked Questions
What is a good Sharpe ratio for a mutual fund?
Above 1 is a reasonable starting point and above 1.5 is genuinely good. The important thing is to compare within the same fund category a debt fund and a smallcap fund are completely different boards and the same Sharpe ratio means different things across them.
Can the Sharpe ratio be negative?
Yes. If the fund returned less than a risk-free FD over the same period, the Sharpe ratio goes negative. It means you sat through a wild board and still came out behind the safest option available.
Which should I look at first Sharpe ratio or CAGR?
Depends on what you’re trying to understand. CAGR tells you the result. Sharpe ratio tells you the quality of how that result was achieved. For comparing two similar funds, Sharpe ratio is far more useful. You really do need both.
Does the Sharpe ratio work for individual stocks too?
Yes same logic. Some stocks are Version A boards, some are Version B. For a full portfolio, the Sharpe ratio gives you a sense of overall risk-return efficiency, not just individual positions.
Is risk adjusted return the same thing as Sharpe ratio?
Risk adjusted return is the broader concept understanding what you earned relative to what you risked. The Sharpe ratio is one way to measure it. There are others like the Sortino ratio, but Sharpe is the most widely used and easiest to find data on.
Why don’t most apps show the Sharpe ratio prominently?
Honestly, because CAGR looks better in marketing. A fund with a flashy 3-year return and a poor Sharpe ratio is easier to sell than one with a modest return and a strong risk-adjusted profile. Platforms that surface the Sharpe ratio are making it harder to hide what the return actually costs.