

Last updated: June 2026 · 7 min read
Track sector rotation with a live Relative Rotation Graph (RRG) chart. Spot leading, weakening, lagging & improving sectors instantly using RRG analysis
| IN SHORTA Relative Rotation Graph (RRG) is a visual tool that shows which sectors are gaining strength and which ones are losing steam compared to a benchmark like the Nifty 500. Instead of flipping through a dozen charts, one RRG gives you a quick picture of where market leadership is shifting and where money might be headed next. |
Why Do Some Sectors Suddenly Become Popular?
If you watch cricket, you already know this feeling. Not every player shines in every match. Sometimes the opener steals the show. In the next game, it is the middle order carrying the team. The squad stays the same, but the man on top of the scoreboard keeps changing.
The stock market works in a similar way.
Money does not leave the market, it just moves around. At one point banking stocks lead the pack. A few months later, IT or pharma starts pulling the attention. This constant shifting of money from one sector to another is what we call a sector rotation strategy.
If you can spot these shifts early, there is a good chance you avoid jumping into a sector after most of the move is already over.
Think About Your Laptop and Keyboard
Picture your investment portfolio as a laptop. The keyboard keys are your sectors:
- Banking
- IT
- Pharma
- FMCG
- Auto
You do not press every key with the same force. Depending on what you are typing, some keys get hit far more than others.
Sectors behave the same way. Investors do not put money into all of them equally at the same time. They lean towards the ones that look stronger and quietly step back from the ones that seem to be running out of steam.
The tricky part is knowing where that shift is actually happening. That is where a Relative Rotation Graph India starts to earn its place in your research routine.
What is a Relative Rotation Graph?
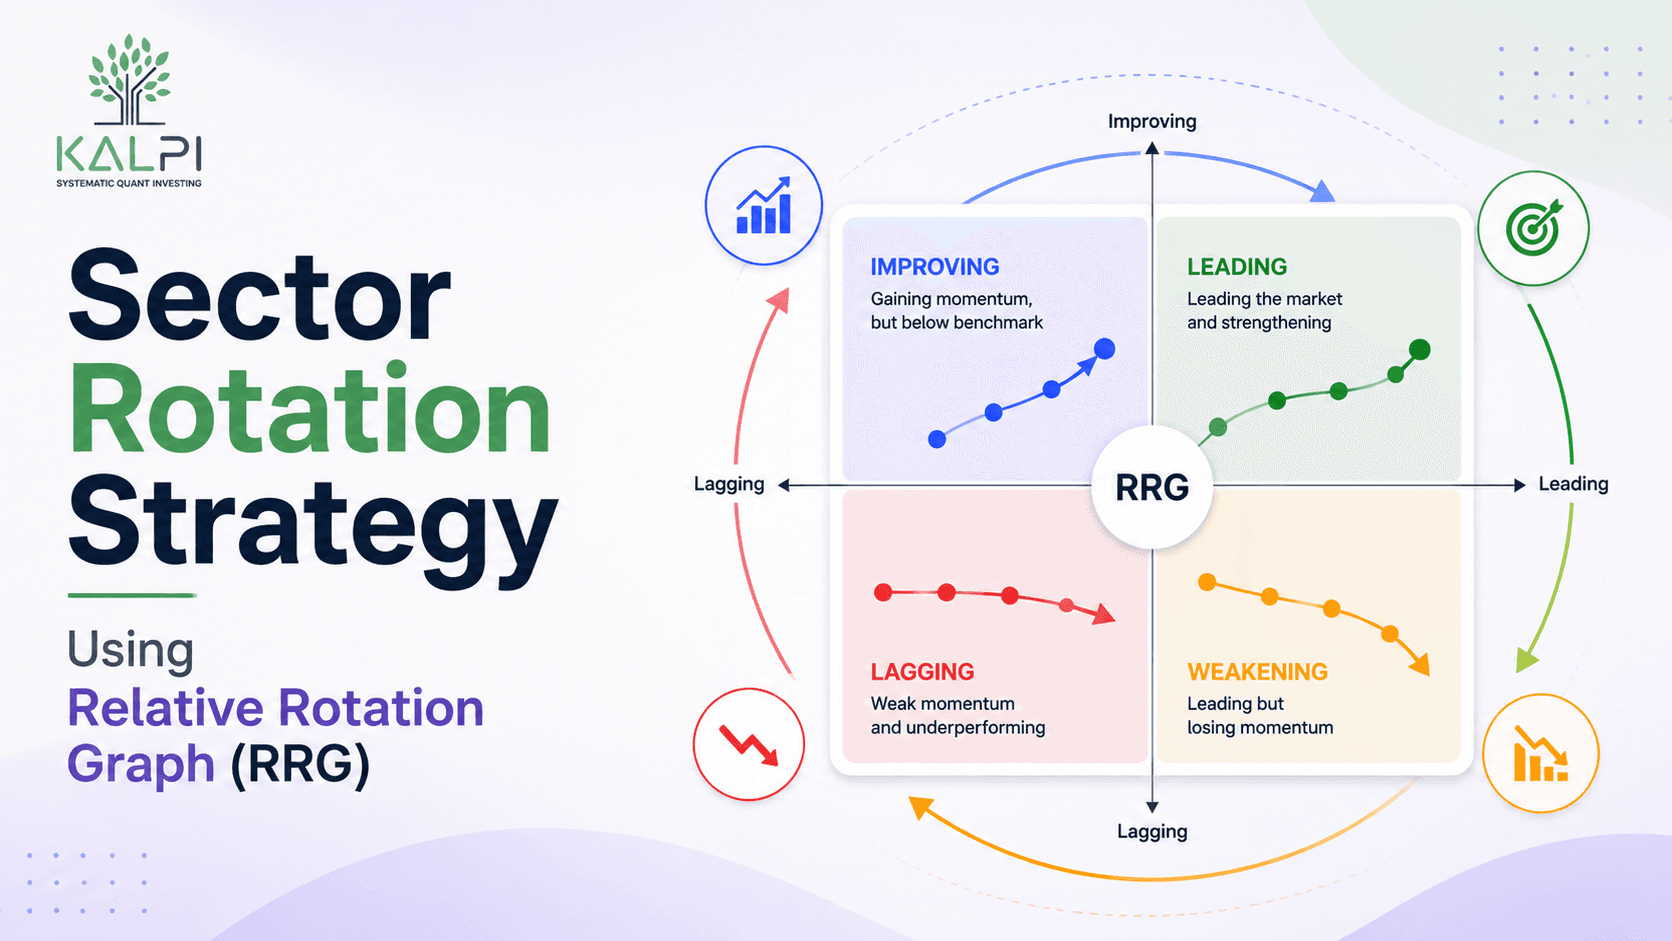
A Relative Rotation Graph, often called an RRG chart India, is a visual tool that compares the relative strength and momentum of different sectors against a benchmark below is a RRG Graph of Kalpi

In India, investors usually compare sectors with:
- Nifty 50
- Nifty 500
- Nifty 500 Multicap Index
Instead of pulling up five or six separate charts, you get a fair idea of what is going on just by glancing at one screen.
Understanding the Four Quadrants
Every sector on the RRG sits in one of four zones. Here is what each one is telling you:
| Quadrant | Meaning | What It Usually Indicates |
|---|---|---|
| Leading | Strong performance and strong momentum | The sector is outperforming the benchmark |
| Weakening | Strong performance but slowing momentum | The rally may be cooling down |
| Lagging | Weak performance and weak momentum | The sector is underperforming |
| Improving | Weak performance but rising momentum | The sector may be starting a recovery |
These names can sound a bit technical the first time you read them. But once you have looked at a handful of real charts, the pattern starts making a lot more sense.
How to Read an RRG
A lot of investors search for how to read RRG simply because the chart looks intimidating at first glance. In reality, the process is fairly straightforward.
Start by picking a benchmark, such as the Nifty 500 or Nifty 50. Then add the sector indices you want to track:
- Nifty Bank
- Nifty IT
- Nifty Pharma
- Nifty FMCG
- Nifty Auto
Now watch how each sector moves. Most sectors travel through a repeating cycle:
| Improving → Leading → Weakening → Lagging, AND THEN THE CYCLE STARTS ALL OVER AGAIN |
The first chart you look at may feel confusing. Give it a few tries and the same pattern starts showing up again and again, and after that it is hard to unsee it.
A Simple Example
Suppose an RRG on a given day shows the following picture:
| Sector | Position on RRG | What an Investor Might Do |
|---|---|---|
| Banking | Leading | Consider increasing exposure |
| Pharma | Improving | Keep it on the watchlist |
| FMCG | Weakening | Review existing positions |
| IT | Lagging | Avoid adding fresh money immediately |
An RRG will not tell you what happens next. What it does is show you where the market’s attention is shifting right now, and that alone can save you from being the last one into a trade.
Why Do Investors Use RRG?
It saves time
Instead of opening chart after chart for every sector, one RRG lets you compare all of them together.
Sector comparison gets easier
You can quickly spot which sectors are leading the pack and which ones are struggling to keep up.
It keeps you from just following the crowd
Sometimes people buy into a sector purely because everyone around them is talking about it. RRG nudges you to check the data first, instead of the noise.
It fits different styles of investing
Long-term investors, active traders, and regular market participants can all fold it into their research process.
A Few Things to Remember
RRG should never be used in isolation. Before you act on anything you see on the chart, it still helps to check:
| Before You Act Company fundamentals Earnings growth Valuation Market conditions Risk management |
Think of an RRG as a map. A map can point you in a direction, but you still have to decide which road to actually take.
Final Thoughts
Just when everyone starts talking about one sector, another one quietly starts moving in the background. That is exactly why so many investors keep an eye on sector rotation.
A sector rotation strategy paired with a Relative Rotation Graph can help you understand where strength is building and where it might be starting to fade.
Sometimes the better question is not “which stock should I buy”. Instead, try asking “which sector is starting to wake up”.
Paying attention to sectors before stocks can help you spot opportunities you might otherwise have missed.
Frequently Asked Questions
1. What is the Relative Rotation Graph India?
It is a visual tool that compares the strength and momentum of different sectors against a benchmark such as the Nifty 50 or Nifty 500.
2. Is an RRG chart useful for beginners?
Yes. It can look a bit much on the first try, but once you get comfortable with the four quadrants, spotting strong and weak sectors becomes much easier.
3. Can an RRG predict future stock prices?
No, and it never claims to. It does not predict prices or promise any returns. All it shows is how sectors are performing relative to each other, and whether their momentum is building or fading. What you do with that information is up to you.
4. How often should investors check an RRG chart?
There is no fixed rule here. Many investors glance at it once a week, since sector leadership tends to shift gradually rather than overnight.
5. Should I make investment decisions only by looking at an RRG?
No. It works best alongside company fundamentals, valuations, earnings growth, and your own investment goals, rather than standing in as your only tool.