

last updated :July 2026
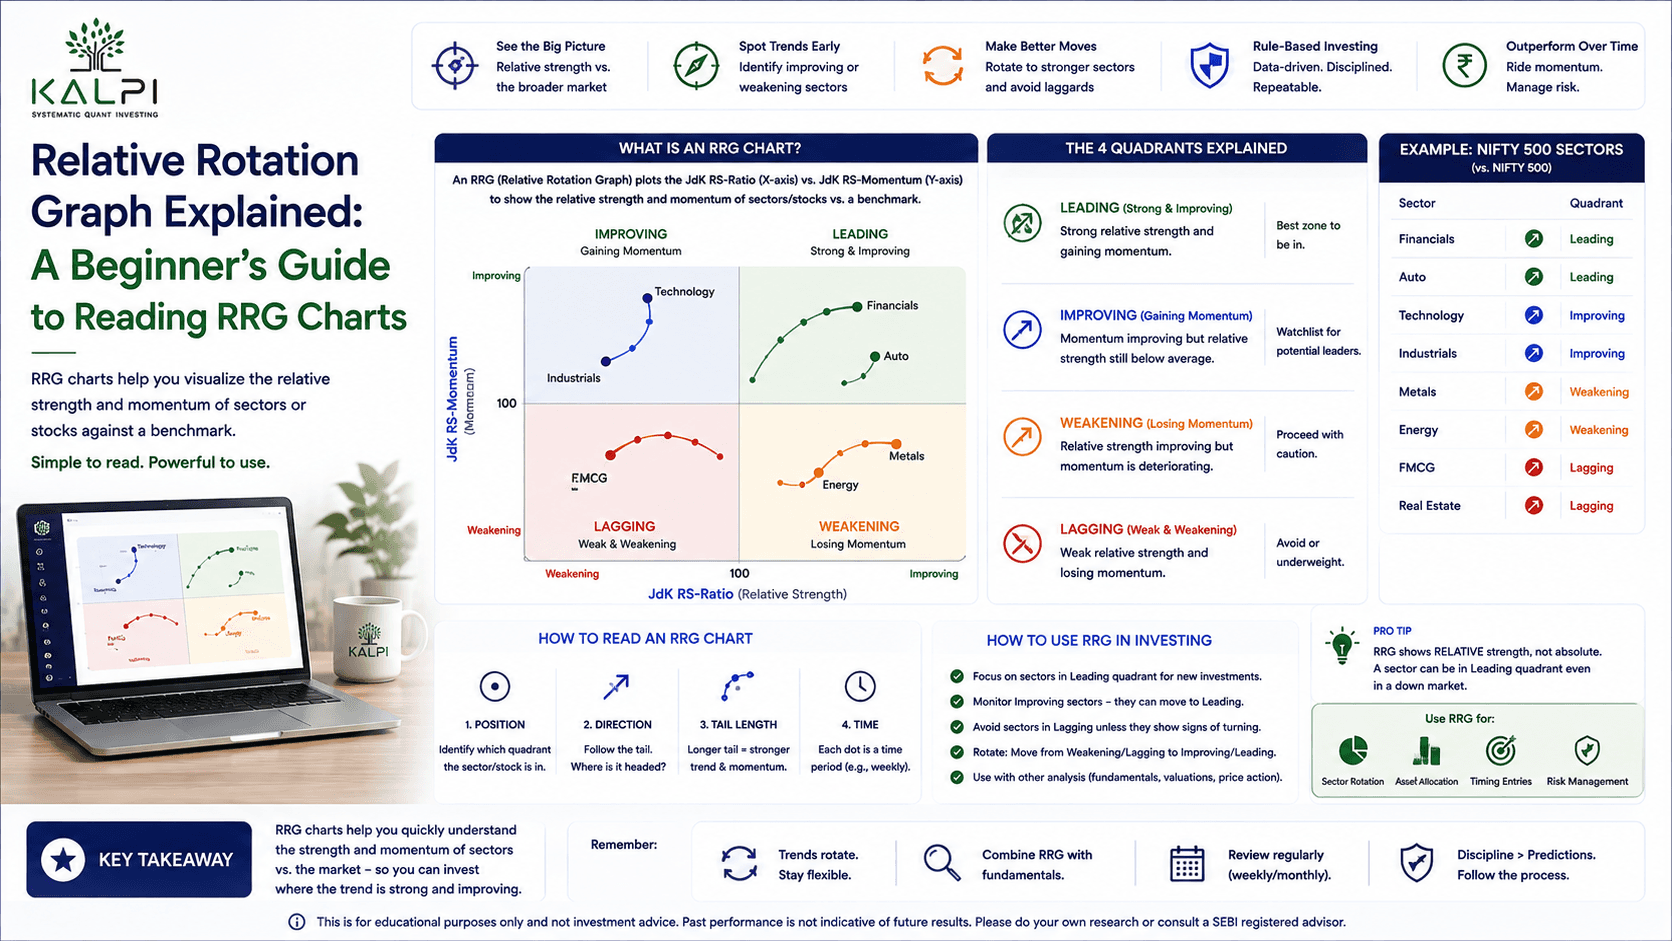
A Relative Rotation Graph, or RRG, is a chart that shows how a stock or sector is performing compared to a benchmark like the Nifty 50. It tells you if that sector is gaining strength, losing steam, or quietly turning around, all in one glance, instead of you checking dozens of separate charts.
Why sectors don’t move together
Think of a marathon with twenty runners. Everyone starts together, but after a few kilometres, some pull ahead, some slow down, and a few who were lagging start catching up.
The stock market behaves the same way. Banking stocks might lead for a few months. Then IT takes over. Later, pharma or auto stocks start doing better while everyone else cools off.
This constant shifting of leadership is called sector rotation. The hard part is spotting the shift early, before it shows up everywhere in the news.
This is exactly what an RRG is built for. Instead of studying one stock chart at a time, you can put several sectors on the same graph and see at a glance who’s pulling ahead and who’s falling behind.
At first look, an RRG chart can seem confusing. It doesn’t look like a normal price chart at all. But once you understand what each part of the chart means, it becomes much easier to read.

A full RRG chart with the four quadrants, showing Nifty Bank, Nifty IT and Nifty Pharma plotted against Nifty 50.
What is a Relative Rotation Graph
A Relative Rotation Graph compares how one stock or sector is doing against another, usually a benchmark index.
A normal chart asks: did this stock go up or down?
An RRG asks a different question: did this stock do better or worse than the market?
That difference matters more than people realise. Say a stock rises 5% in a month. Sounds decent, until you notice the Nifty 50 rose 10% in the same time. That stock actually underperformed, even though its price went up.
An RRG shows this kind of relative performance clearly, without you having to do the math yourself for every stock.
The four RRG quadrants explained
Every RRG chart is split into four zones. Each one tells you something different about how a stock or sector is doing right now.
Leading quadrant
Stocks or sectors here are beating the benchmark and still have good momentum. These are usually the strongest performers at that moment.
If banking stocks sit in the leading quadrant, it means banks are currently doing better than the overall market. That doesn’t guarantee they’ll keep doing well forever. It just tells you where things stand today.
Weakening quadrant
These sectors are still ahead of the benchmark, but their momentum is slowing down. Picture a runner who is still in first place but has started to tire. He’s ahead for now, but others might catch up soon.
A sector in this zone isn’t necessarily in trouble. It’s just showing early signs that its lead might not last.
Lagging quadrant
Here you’ll find sectors that are behind the benchmark and losing momentum too. These are the weakest performers on the chart right now.
If the metal sector sits in lagging for weeks, it usually means investors are finding better opportunities in other places. That doesn’t mean you write it off forever though. Sectors do recover from here, sometimes after a long wait.
Improving quadrant
This is the zone most investors keep an eye on. Sectors here are still behind the benchmark, but momentum is picking up.
Think of a runner who started slow but is now gaining pace. He hasn’t caught the leaders yet, but you can see him closing the gap.
Some sectors in this quadrant do eventually move into leading. Others fade again before getting there. So this quadrant is worth watching, not blindly buying into.

An RRG stock list panel showing Nifty Bank, Nifty IT and Nifty Pharma with their ratio, momentum and current quadrant tags.
How RRG sector rotation actually works
The real value of an RRG comes from watching sectors move between quadrants over time, not just checking where they sit today.
A typical rotation often looks like this:
Leading → Weakening → Lagging → Improving → back to Leading
Say banking stocks spend a few months in leading. As momentum slows, they drift into weakening. If that weakness continues, they slide into lagging. Eventually, fresh buying returns and pushes them into improving, before some sectors climb back to leading again.
Not every sector follows this cycle neatly. Some sectors stay leaders for a long stretch. Others bounce briefly and turn weak again just as fast.
An RRG doesn’t predict what happens next. It only shows you where a sector stands right now, relative to the benchmark. That’s still useful information, because it helps you notice change earlier than a plain price chart would.
Understanding RS-Ratio and RS-Momentum
Two numbers sit behind every RRG chart.
JdK RS-Ratio tells you how a stock or sector is doing compared to the benchmark. A higher number means it’s outperforming. A lower number means it’s underperforming. It’s not about whether the price went up today, it’s about whether it beat the market.
JdK RS-Momentum tells you if that relative strength is improving or fading.
Here’s a simple way to picture it. Imagine mixing red and blue paint. Red is the stock, blue is the Nifty 50. Add more red, and the mix turns redder, meaning the stock is gaining strength against the benchmark. Add more blue instead, and the mix turns blue again, meaning the benchmark is pulling ahead.
The colour doesn’t change all at once. It shifts gradually. RS-Momentum works the same way, picking up on that shift early, often before it’s obvious on a regular price chart.
Table 1: RRG quadrants at a glance
| Quadrant | Relative to benchmark | Momentum | What it usually means |
| Leading | Outperforming | Strong | Currently the strongest performer |
| Weakening | Outperforming | Slowing | Still ahead, but losing steam |
| Lagging | Underperforming | Weak | Currently the weakest performer |
| Improving | Underperforming | Picking up | Early signs of a possible turnaround |
A simple example
Say banking stocks are sitting in leading while IT is stuck in lagging. This tells you banks are currently doing better than the broader market, and IT is falling behind.
A few weeks pass. Banking starts drifting toward weakening, and IT begins moving into improving.
This isn’t a signal to immediately sell your bank stocks and buy IT. It’s a signal to look closer. Check the price charts, look at earnings, check valuations, and see if the shift is backed by anything real.
An RRG points you toward where to look. It shouldn’t be the only reason you make a trade.
Common mistakes people make with RRG
RRGs are genuinely useful, but they get misused often. A few mistakes to avoid:
- Buying every stock the moment it enters leading
- Selling in a panic the second something moves into weakening
- Ignoring company fundamentals and only watching the chart
- Using RRG without checking the overall market trend
- Assuming every stock in improving will eventually become a leader
An RRG is meant to support your research, not replace it.
When should you actually use an RRG
RRG charts work best when you’re comparing multiple sectors or stocks together, not analysing one company on its own.
Good use cases include:
- Comparing Nifty sector indices against each other
- Spotting sectors with improving momentum early
- Tracking how market leadership is shifting
- Reviewing how your portfolio is allocated across sectors
- Shortlisting sectors that deserve a closer look
It’s less useful if you’re trying to judge a single company’s financial health. For that, you still need balance sheets, earnings reports and valuation numbers. An RRG doesn’t replace any of that.
Table 2: RRG versus a regular price chart
| Question it answers | Price chart | RRG chart |
| Did the stock go up or down | Yes | No |
| Is it beating the benchmark | No | Yes |
| Is that relative strength improving | No | Yes |
| Good for comparing many sectors at once | Not easily | Yes |
Why RRG works best with other tools
No single chart tells you the full story. An RRG shows relative performance, but it won’t tell you if a company has strong fundamentals, if the stock is fairly valued, or if earnings are actually growing.
That’s why most experienced investors don’t rely on RRG alone. They pair it with financial statements, valuation ratios and regular price charts before making a call.
Final thoughts
A Relative Rotation Graph is a genuinely useful way to understand how market leadership shifts between sectors. Instead of only watching price movement, it shows you how a sector is doing relative to everyone else.
It might look unfamiliar the first time you see one. But once you understand the four quadrants, along with RS-Ratio and RS-Momentum, reading an RRG becomes second nature.
Its biggest strength is helping you notice a change in leadership before it becomes obvious to the rest of the market. Just remember, it works best as one part of your research, not the whole thing.
Think of it like a map. It points you in a direction. You still need other tools to decide if that direction is worth taking.
Frequently asked questions
1. What is a Relative Rotation Graph (RRG)?
It’s a chart that compares the relative strength and momentum of stocks or sectors against a benchmark, such as the Nifty 50.
2. What are the four RRG quadrants?
Leading, Weakening, Lagging and Improving. Each one shows a different stage of relative performance and momentum.
3. What is RRG sector rotation?
It’s the natural movement of sectors from one quadrant to another as market leadership changes over time.
4. Can an RRG predict future stock prices?
No. It only shows current relative strength and momentum. It doesn’t forecast what happens next.
5. Should I use an RRG on its own to make investment decisions?
No. It works best alongside price charts, company fundamentals and valuation checks, not as a standalone signal.