

Imagine you are hiring a tuition teacher.
Before making your decision, you would probably ask two questions.
First, does the teacher actually have the knowledge and experience to help students perform better? Second, is the teacher financially stable enough to continue teaching consistently, instead of shutting down the coaching centre after a few months?
When investors buy a company’s shares, they face a similar situation.
Most people get busy tracking profits, revenue or the latest share price. Very few take the time to understand the company’s financial position. That is exactly what a balance sheet helps you do.
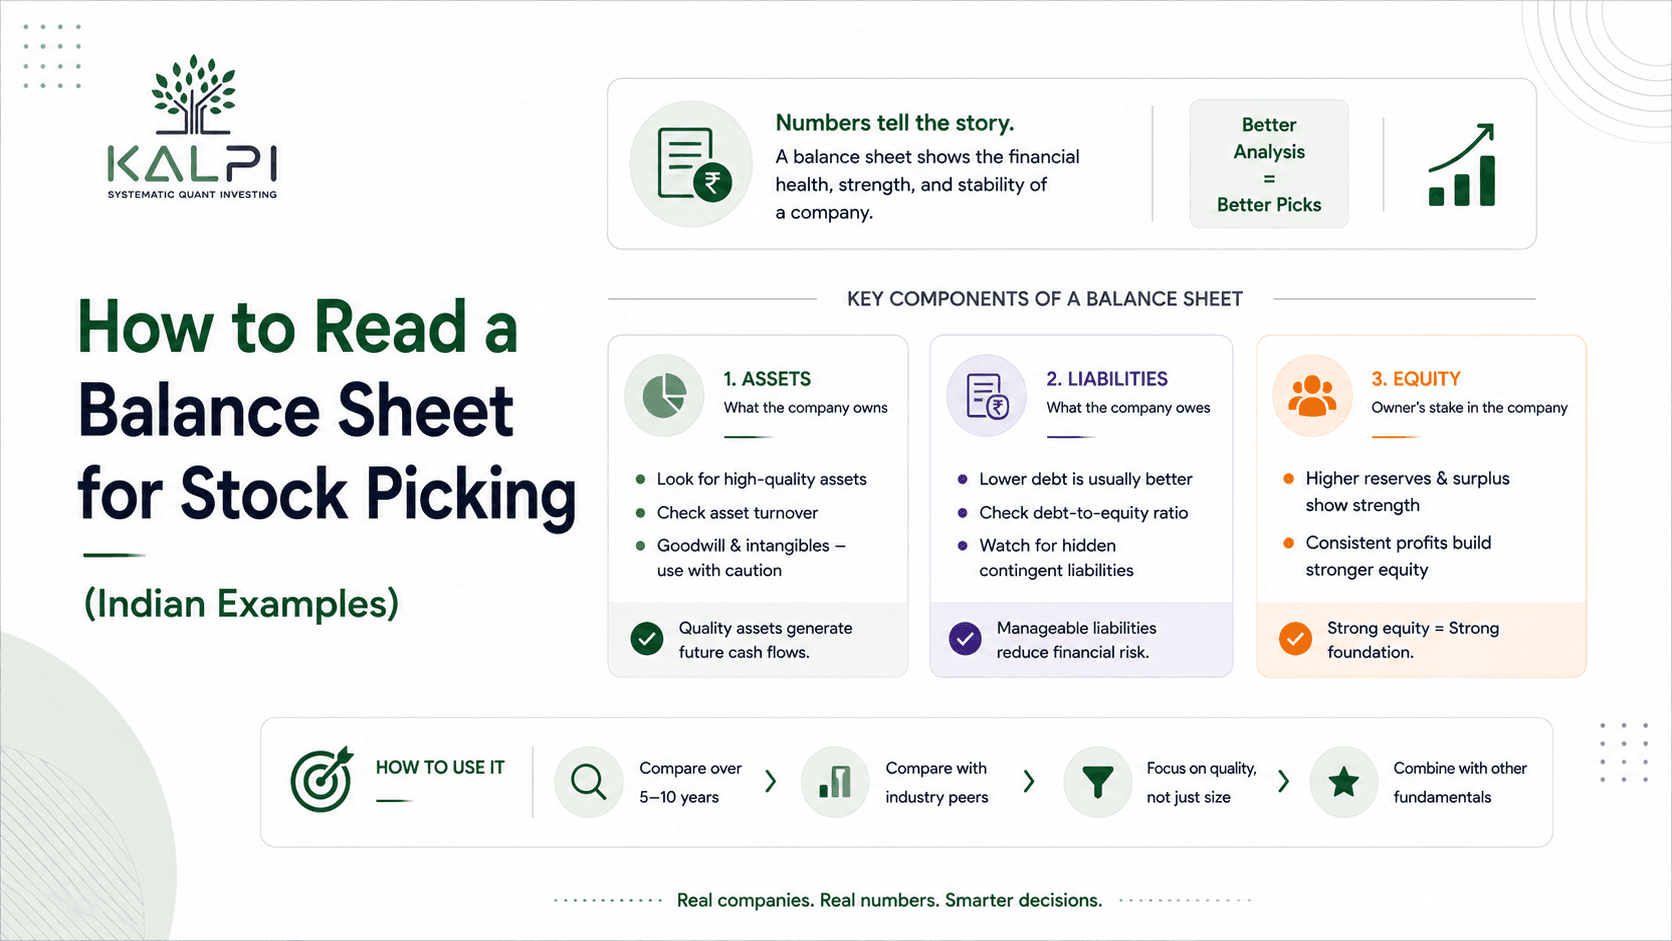
It shows what a company owns, what it owes and how much truly belongs to its shareholders.
Learning how to read balance sheet for stock picking allows investors to look beyond headlines and understand whether a business is financially strong, or quietly carrying risks that may not be obvious from the profit numbers alone.
This is one of the most important skills in fundamental analysis India, especially for long-term investors who want to build portfolios based on business quality rather than short-term market excitement.
In this guide, we will break down every major section of a balance sheet using simple Indian examples, understand the key financial ratios investors should track, and see how balance sheet analysis can improve stock-picking decisions.
What Is a Balance Sheet?
A balance sheet is a financial statement that gives a snapshot of a company’s financial position at a particular point in time.
Unlike the income statement, which measures performance over a period, the balance sheet captures where the business stands on a specific date.
It answers three simple questions:
- What does the company own?
- What does the company owe?
- How much belongs to the shareholders?
These three parts form the foundation of every balance sheet.
Assets = Liabilities + Shareholders’ Equity
Every balance sheet you will ever look at is built on this one equation.

At first glance, the formula may look technical, but the idea is straightforward.
Imagine someone buying a house worth ₹80 lakh. Suppose they pay ₹20 lakh from their own savings and borrow the remaining ₹60 lakh from a bank.
The house is the asset. The home loan is the liability. The ₹20 lakh contributed by the buyer represents the owner’s equity.
Businesses follow exactly the same principle. Everything a company owns has been financed either through borrowed money or through the shareholders’ own investment. This simple relationship forms the foundation of balance sheet analysis.
The Three Building Blocks of Every Balance Sheet
Every balance sheet contains three major sections:
- Assets
- Liabilities
- Shareholders’ Equity
Understanding these three sections makes reading almost any balance sheet significantly easier.
Assets
Assets represent everything the company owns or controls that helps generate future income.
Examples include:
- Cash
- Inventory
- Buildings
- Machinery
- Investments
- Patents
Assets are generally divided into current assets and non-current assets, which we will discuss shortly.
Liabilities
Liabilities represent everything the company owes to others.
Examples include:
- Bank loans
- Supplier payments
- Outstanding expenses
- Bonds
- Taxes payable
Some liabilities need to be paid within one year, while others extend over many years.
Shareholders’ Equity
Shareholders’ equity represents the owners’ claim after all liabilities have been deducted from total assets.
In simple words, if the company sold everything it owned and repaid every outstanding obligation, whatever remained would belong to the shareholders. This is why equity is often viewed as the company’s net worth.
Why Investors Should Read the Balance Sheet
Many beginners spend most of their time looking at profits or stock charts while completely ignoring the balance sheet. That can become a costly mistake.
A company may report impressive profits while carrying excessive debt. Another business may experience temporary profit pressure despite having a very strong financial position.
The balance sheet helps investors identify these differences. It allows you to evaluate whether a company’s growth is supported by genuine financial strength, or driven mainly by increasing borrowings.
Instead of relying only on earnings, investors get a much clearer picture of the business’s long-term stability. That is exactly why understanding how to read balance sheet for stock picking forms an essential part of fundamental analysis India.
Understanding Assets: What a Company Owns
Open almost any company’s balance sheet, and the first thing you will notice is a long list of assets.
These assets tell you what the business owns and, more importantly, what helps it generate money.
Imagine you own a small bakery. The ovens, refrigerators, delivery scooter, flour stored for tomorrow’s orders and even the cash sitting in the bank all help the bakery operate smoothly. Together, they form the bakery’s assets because they contribute to earning future income.
Companies work in exactly the same way.
Some assets are physical, while others exist only on paper. Both can be valuable if they help the business grow or generate cash over time.
Assets are broadly divided into two categories:
- Current Assets
- Non-Current Assets
Understanding the difference between these two categories is one of the first steps in learning how to read balance sheet for stock picking.
Current Assets
Current assets are resources that a company expects to use, sell or convert into cash within one year.
Common current assets include:
- Cash and cash equivalents
- Bank balances
- Inventory
- Trade receivables
- Short-term investments
- Other current assets
Imagine a grocery shop. The vegetables on the shelves, the cash in the drawer and the money customers still owe the shopkeeper are all current assets, because they are expected to become cash fairly soon.
For investors, healthy current assets usually indicate that a company can comfortably manage its day-to-day operations without facing unnecessary financial pressure.
However, looking only at the total value is not enough. The quality of those assets matters just as much.
For example, a company may report very high inventory. At first glance, that looks positive. But if those products have been sitting in warehouses for months because demand has slowed, high inventory could actually become a warning sign.
The same applies to trade receivables. If customers are taking much longer than usual to pay the company, future cash flow may come under pressure.
The same inventory number can mean different things. Rising stock before festive season is healthy for a growing FMCG company, but the same rise for a retailer whose products are not selling is a warning. Numbers always need context.
Non-Current Assets
Non-current assets are resources that continue benefiting a business for many years instead of being converted into cash within one year.
These commonly include:
- Property
- Plant and machinery
- Buildings
- Land
- Long-term investments
- Goodwill
- Patents and trademarks
Think about your own tuition teacher. The classroom, whiteboard, projector, tables and reference books are not replaced every few months. They help students learn year after year.
Businesses have similar long-term resources.
For manufacturing companies, factories and machinery often form a significant portion of total assets. Technology companies, on the other hand, may own fewer physical assets but possess valuable software, patents, brands or intellectual property.
This is why investors should always evaluate assets within the context of the business itself. Comparing a software company with a steel manufacturer rarely leads to meaningful conclusions, because both operate very differently. It makes more sense to compare peers in the same industry.
What Investors Should Look For
While analysing assets, avoid assuming that “more assets” automatically means “better company.”
Instead, ask questions like:
- Are assets growing steadily over time?
- Is inventory increasing because sales are growing, or because products are not selling?
- Are receivables being collected on time?
- Is the company generating higher revenue from its existing assets?
- Do these assets genuinely strengthen the business?
For example, if two companies generate similar revenue but one requires significantly fewer assets to achieve it, that business may be operating more efficiently. Over long periods, efficient businesses often create greater value for shareholders.
Understanding Liabilities: What a Company Owes
Once you understand what a company owns, the next step is understanding what it owes. Looking at only one side of the balance sheet gives you an incomplete picture.
Every business borrows money at some stage. It may take loans from banks, purchase raw materials on credit or delay payments to suppliers as part of normal business operations.
None of these are automatically bad. The real question is whether those liabilities remain manageable.
Imagine someone buying a scooter. Taking a small loan and comfortably paying the monthly instalments is very different from borrowing far beyond what they can realistically afford.
A business runs on the same logic. Borrowing can support growth, but too much of it can quickly turn into financial stress.
Liabilities are generally divided into two categories:
- Current Liabilities
- Non-Current Liabilities
Current Liabilities
Current liabilities are obligations that must be paid within one year.
These commonly include:
- Trade payables
- Short-term borrowings
- Outstanding expenses
- Taxes payable
- Current portion of long-term debt
Imagine a clothing shop that receives fresh inventory every month but pays its suppliers after 30 days. Those unpaid supplier bills are current liabilities, because they need to be settled in the near future.
Most businesses operate in a similar way. Having current liabilities is perfectly normal. What matters is whether the company has enough current assets to meet those obligations comfortably.
Non-Current Liabilities
Non-current liabilities are obligations that become due after more than one year.
Examples include:
- Long-term loans
- Bonds
- Deferred tax liabilities
- Long-term lease obligations
Many companies borrow money to expand operations, build factories, purchase machinery or invest in future growth. Borrowing itself is not a problem.
The real concern is whether the company generates enough earnings and cash flow to repay those obligations without putting the business under pressure. This is where important financial measures such as the debt to equity ratio become useful, something we will explore in the next section.
What Investors Should Look For
While analysing liabilities, ask yourself:
- Is debt increasing faster than profits?
- Can the company comfortably repay its borrowings?
- Are current liabilities well covered by current assets?
- Is borrowing helping the business grow, or simply covering ongoing losses?
A company with manageable liabilities and consistent earnings is usually in a much stronger position during difficult market conditions than one carrying excessive debt.
Looking at assets without liabilities is like judging a student’s marks without understanding how they achieved them. Both sides complete the story.
Once you understand what a company owns and what it owes, reading a balance sheet becomes much less intimidating and far more useful for making better stock-picking decisions.

Key Ratios Every Investor Should Check
Once you understand assets, liabilities and shareholders’ equity, the next step is learning a few important financial ratios.
These ratios help investors compare companies more objectively instead of relying only on absolute numbers. You do not need to memorise dozens of formulas. A handful of well-understood ratios can reveal a great deal about a company’s financial strength.
Debt-to-Equity Ratio
One of the most widely used measures in balance sheet analysis stock is the debt to equity ratio.
It compares the company’s total debt with shareholders’ equity and helps investors understand how much borrowing the business is using to finance its operations.
In general, a lower ratio indicates that a company relies less on borrowed money. However, there is no universal benchmark.
For example, banks, infrastructure companies and power businesses usually operate with much higher debt than software or FMCG companies. This is why the ratio should always be compared with businesses from the same industry, rather than using one fixed number for every company.
Judging TCS and a power utility on the same debt to equity yardstick gives a misleading picture. Compare TCS with Infosys, or one power company with another.
Current Ratio
The current ratio compares current assets with current liabilities.
It answers a simple question: Can the company comfortably meet its short-term obligations?
For instance, if a company has ₹200 crore in current assets and ₹100 crore in current liabilities, its current ratio is 2. This means it has twice the short-term resources needed to meet its short-term obligations.
A consistently healthy current ratio generally indicates stronger financial stability, though an unusually high one can point to idle cash or underused assets.
Return on Equity (ROE)
Return on Equity, or ROE, measures how efficiently a company uses shareholders’ money to generate profits.
A consistently high ROE often reflects efficient management, provided it is supported by genuine business performance rather than excessive borrowing.
Asset Turnover Ratio
The asset turnover ratio shows how efficiently a business uses its assets to generate revenue.
If two companies generate similar sales but one requires significantly fewer assets to achieve the same result, that business is generally operating more efficiently.
Important Balance Sheet Ratios at a Glance
| Ratio | What It Indicates | Why It Matters |
|---|---|---|
| Debt-to-Equity Ratio | Borrowing compared with shareholders’ funds | Helps assess financial risk |
| Current Ratio | Ability to meet short-term obligations | Indicates liquidity position |
| Return on Equity (ROE) | Profit generated from shareholders’ capital | Measures management efficiency |
| Asset Turnover Ratio | Revenue generated from total assets | Shows operational efficiency |
Balance Sheet Red Flags Investors Should Watch
A balance sheet often reveals warning signs long before they become visible in profits or share prices.
Some common red flags include:
- Debt increasing consistently while profits remain flat
- Inventory growing much faster than sales
- Trade receivables rising every quarter without corresponding revenue growth
- Falling cash balances despite reporting healthy profits
- Shareholders’ equity declining over multiple years
- Frequent equity dilution through repeated share issuances without meaningful business growth
- Weak operating cash flow despite rising reported profits
One warning sign alone does not necessarily make a company a poor investment. However, when several of these appear together, they deserve closer investigation before making any investment decision.
Healthy Signs vs Warning Signs
| Healthy Signs | Warning Signs |
|---|---|
| Stable or rising cash balance | Rapidly falling cash reserves |
| Manageable debt levels | Debt growing much faster than earnings |
| Assets growing alongside business expansion | Inventory piling up without matching sales growth |
| Consistent shareholders’ equity | Declining equity over multiple years |
| Comfortable liquidity position | Difficulty meeting short-term obligations |
How to Use the Balance Sheet Along With Other Financial Statements
A balance sheet should never be analysed in isolation. It works best when combined with the income statement and the cash flow statement.
Think of these three financial statements as three pieces of the same puzzle.
The balance sheet shows the company’s financial position. The income statement explains how profits were earned. The cash flow statement reveals whether those reported profits are actually turning into cash.
In practice, looking at only one statement can easily give an incomplete picture. Studying all three together provides a much clearer understanding of the company’s financial health and long-term sustainability.
Final Thoughts
Reading a balance sheet may feel intimidating the first time you try, but the basic ideas are surprisingly simple once they click.
It tells you what a company owns, what it owes and how much truly belongs to its shareholders. Once you understand assets, liabilities and equity, the numbers stop looking like accounting jargon and start telling the actual story of the business.
Successful investors rarely pick companies based only on rising share prices or attractive headlines. They spend time understanding financial strength, debt levels, liquidity and business quality before putting their money in, and the balance sheet is where that homework usually begins.
Like most investing skills, it gets easier with practice. The more annual reports you go through, the faster you will spot financially strong businesses, and the quicker you will notice the warning signs.
Great investing rarely starts with finding the next multibagger. It starts with knowing the business well enough to decide whether it deserves your money, and a balance sheet, read carefully, tells you more than most headlines ever will.
Frequently Asked Questions
What is a balance sheet in simple words?
A balance sheet is a financial statement that shows what a company owns, what it owes and the shareholders’ equity at a specific point in time.
Why is the balance sheet important for stock picking?
It helps investors evaluate a company’s financial strength, debt levels, liquidity and long-term stability before making investment decisions.
What is a good debt-to-equity ratio?
There is no universal benchmark. A suitable debt-to-equity ratio depends on the industry, so investors should compare companies operating in the same sector.
Can a profitable company still have a weak balance sheet?
Yes. A company may report strong profits while carrying excessive debt or facing cash flow problems. That is why analysing the balance sheet is just as important as studying earnings.
Should beginners learn balance sheet analysis?
Absolutely. Understanding the basics of balance sheet analysis stock helps investors make informed decisions instead of relying only on market sentiment, stock tips or short-term price movements.