> ## Documentation Index
> Fetch the complete documentation index at: https://kalpi.ai/docs/llms.txt
> Use this file to discover all available pages before exploring further.
# Indices
> Track real-time market benchmark performance, fundamental valuations, and systemic risk.
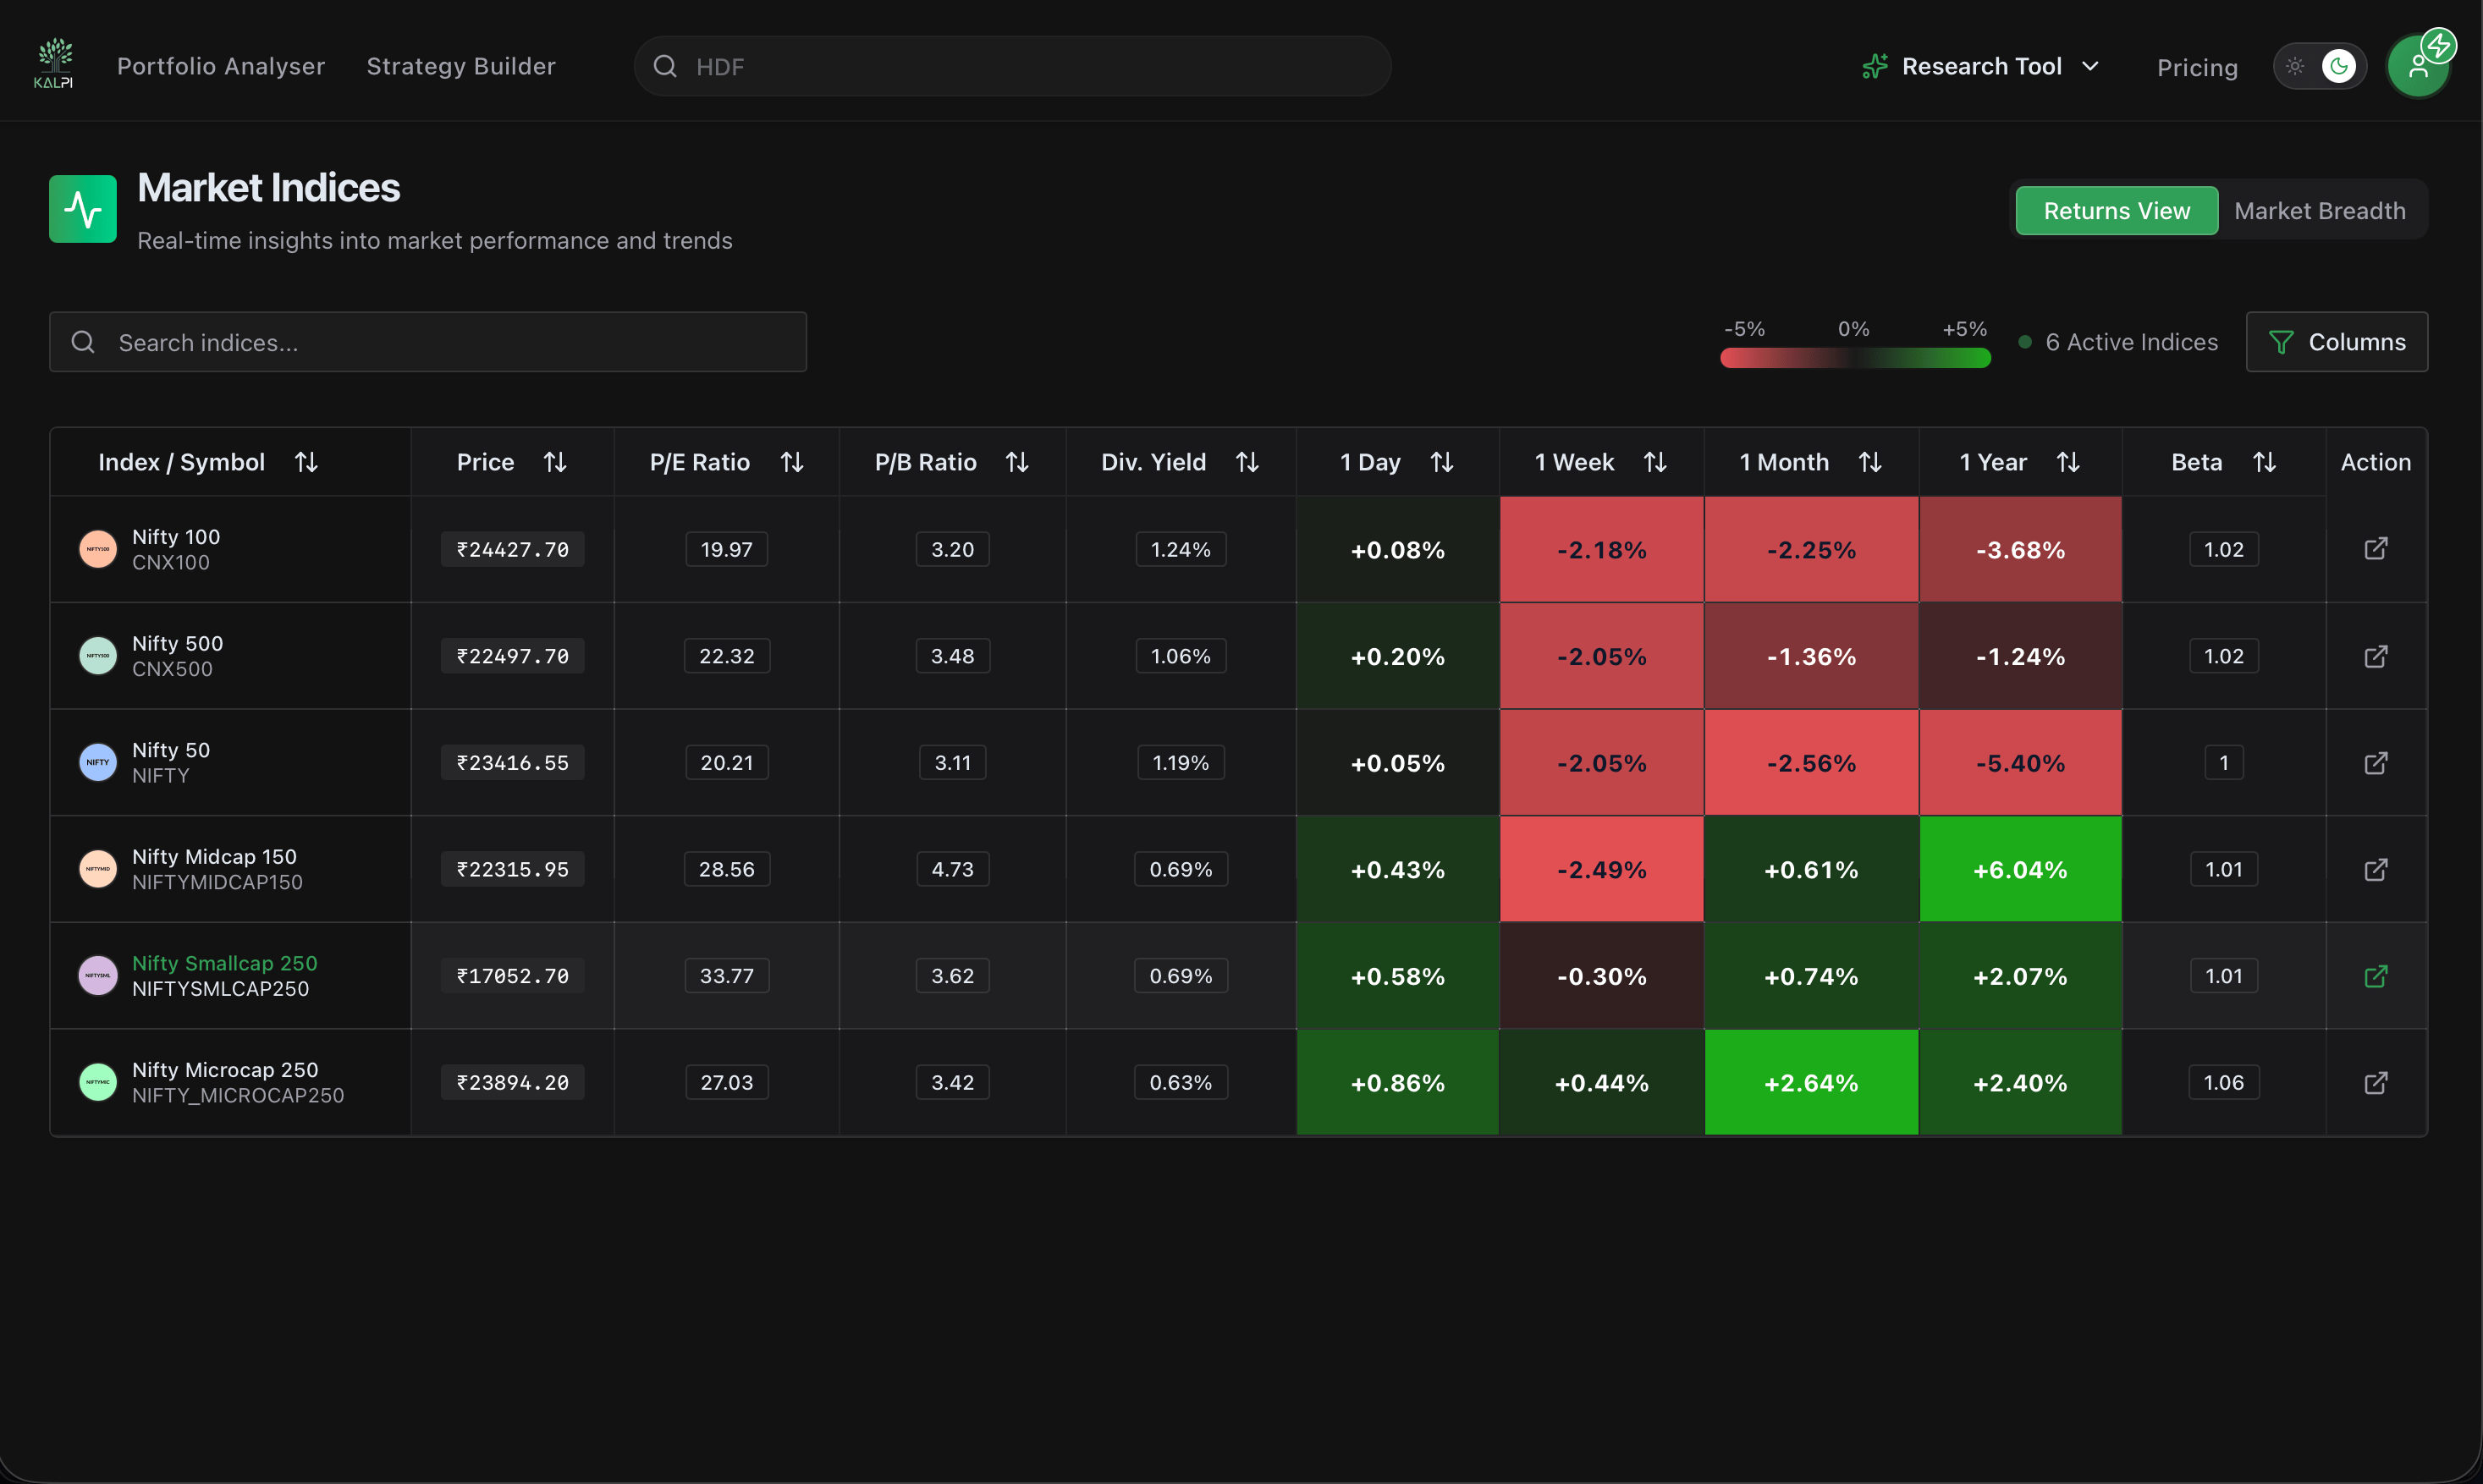
The **Market Indices** dashboard provides a comprehensive overview of the foundational benchmarks driving the Indian equity ecosystem. It simplifies macro analysis by putting performance, valuation, and market breadth all on one screen.
 ## Navigating the Dashboard
The dashboard is split into two primary analytical views, which you can toggle using the buttons at the top right of the table: **Returns View** and **Market Breadth**.
### 1. Returns View (Default)
This view provides a fundamental and technical snapshot of major indices like the Nifty 50, Nifty Bank, and Nifty Midcap 150.
* **Core Valuations:** Monitor index-level fundamental health with real-time columns for **P/E Ratio**, **P/B Ratio**, and **Div. Yield**.
* **Momentum & Performance:** Spot trend shifts instantly with color-coded performance blocks tracking **1 Day**, **1 Week**, **1 Month**, and **1 Year** returns.
* **Systemic Risk (Beta):** Evaluate comparative market volatility.
* **Custom Columns:** Click the **Columns** filter at the top right to cleanly toggle specific data points on or off to suit your screen size and focus.
### 2. Market Breadth View
Switching to the Market Breadth tab allows you to look *under the hood* of the indices to see the internal participation driving the price action.
* **Moving Average Strength:** Track exactly how many constituents are trading in an uptrend with columns for **Above EMA 20, 50, 100, and 200**.
* **Daily Movers:** Monitor extreme short-term momentum by seeing how many stocks are **Up 4.5% Today** versus **Down 4.5% Today**.
* **52-Week Proximity:** Identify structural breakouts by tracking how many stocks are trading **Near 52W High 5%** or bottoming out near their 52-week lows.
***
## Deep-Dive Analysis
If you want to analyze a specific index further, click the **Action** icon (the small box with an arrow) located at the far right of any index row.
This will immediately transport you to a dedicated research page for that specific index, complete with interactive price charts, **Rolling Returns** analysis, and real-time **Technical Analysis** gauges (Oscillators and Moving Averages) to help you perfectly time your macro entries.
## Navigating the Dashboard
The dashboard is split into two primary analytical views, which you can toggle using the buttons at the top right of the table: **Returns View** and **Market Breadth**.
### 1. Returns View (Default)
This view provides a fundamental and technical snapshot of major indices like the Nifty 50, Nifty Bank, and Nifty Midcap 150.
* **Core Valuations:** Monitor index-level fundamental health with real-time columns for **P/E Ratio**, **P/B Ratio**, and **Div. Yield**.
* **Momentum & Performance:** Spot trend shifts instantly with color-coded performance blocks tracking **1 Day**, **1 Week**, **1 Month**, and **1 Year** returns.
* **Systemic Risk (Beta):** Evaluate comparative market volatility.
* **Custom Columns:** Click the **Columns** filter at the top right to cleanly toggle specific data points on or off to suit your screen size and focus.
### 2. Market Breadth View
Switching to the Market Breadth tab allows you to look *under the hood* of the indices to see the internal participation driving the price action.
* **Moving Average Strength:** Track exactly how many constituents are trading in an uptrend with columns for **Above EMA 20, 50, 100, and 200**.
* **Daily Movers:** Monitor extreme short-term momentum by seeing how many stocks are **Up 4.5% Today** versus **Down 4.5% Today**.
* **52-Week Proximity:** Identify structural breakouts by tracking how many stocks are trading **Near 52W High 5%** or bottoming out near their 52-week lows.
***
## Deep-Dive Analysis
If you want to analyze a specific index further, click the **Action** icon (the small box with an arrow) located at the far right of any index row.
This will immediately transport you to a dedicated research page for that specific index, complete with interactive price charts, **Rolling Returns** analysis, and real-time **Technical Analysis** gauges (Oscillators and Moving Averages) to help you perfectly time your macro entries.