> ## Documentation Index
> Fetch the complete documentation index at: https://kalpi.ai/docs/llms.txt
> Use this file to discover all available pages before exploring further.
# Portfolio Backtester
> Engineered to stress-test custom asset allocations, simulate rebalancing strategies, and audit institutional-grade risk metrics.
The **Portfolio Backtester** is one of the most powerful core MVP engines within the Kalpi platform. Instead of guessing how a specific basket of equities or sector weights might perform under diverse macroeconomic regimes, this terminal allows you to mathematically simulate your investment strategies against historical exchange data.
Refer to the complete setup and multi-tab output demonstration below to see the engine execute live simulations.
## Phase 1: Configuring Your Simulation
Building a statistically sound backtest requires setting up precise architectural constraints. Follow these structured steps within the input interface to configure your model:
Select the core comparative baseline index (e.g., *Nifty 50, Nifty Energy, Nifty Financial Services*) against which your portfolio's alpha generation will be directly measured.
Specify how often the engine should mathematically re-align your asset allocations back to their target constraints. Choose from:
* **Never (Buy & Hold):** Assets drift naturally based on price action.
* **Monthly / Quarterly / Yearly:** Automated programmatic re-allocations to lock in gains and manage risk concentrations.
Open the **Configure Dates** module to input your custom simulation start and end parameters. This boundary sets the exact structural window your strategy will navigate.
Input your target equity symbols into the holdings table. To instantly remove calculation errors, utilize the green **Distribute Equally** utility to split allocation percentages perfectly evenly across all assets (e.g., mapping 4 assets to exactly 25.0% each). Once optimized, execute the simulation by clicking **Analyze Portfolio**.
***
## Phase 2: Evaluating the Analytics Suite
Once calculation concludes, the interface generates a specialized, comprehensive analytics report broken into individual high-end tabs.
*Click through the diagnostic scopes below to explore each analytical matrix:*
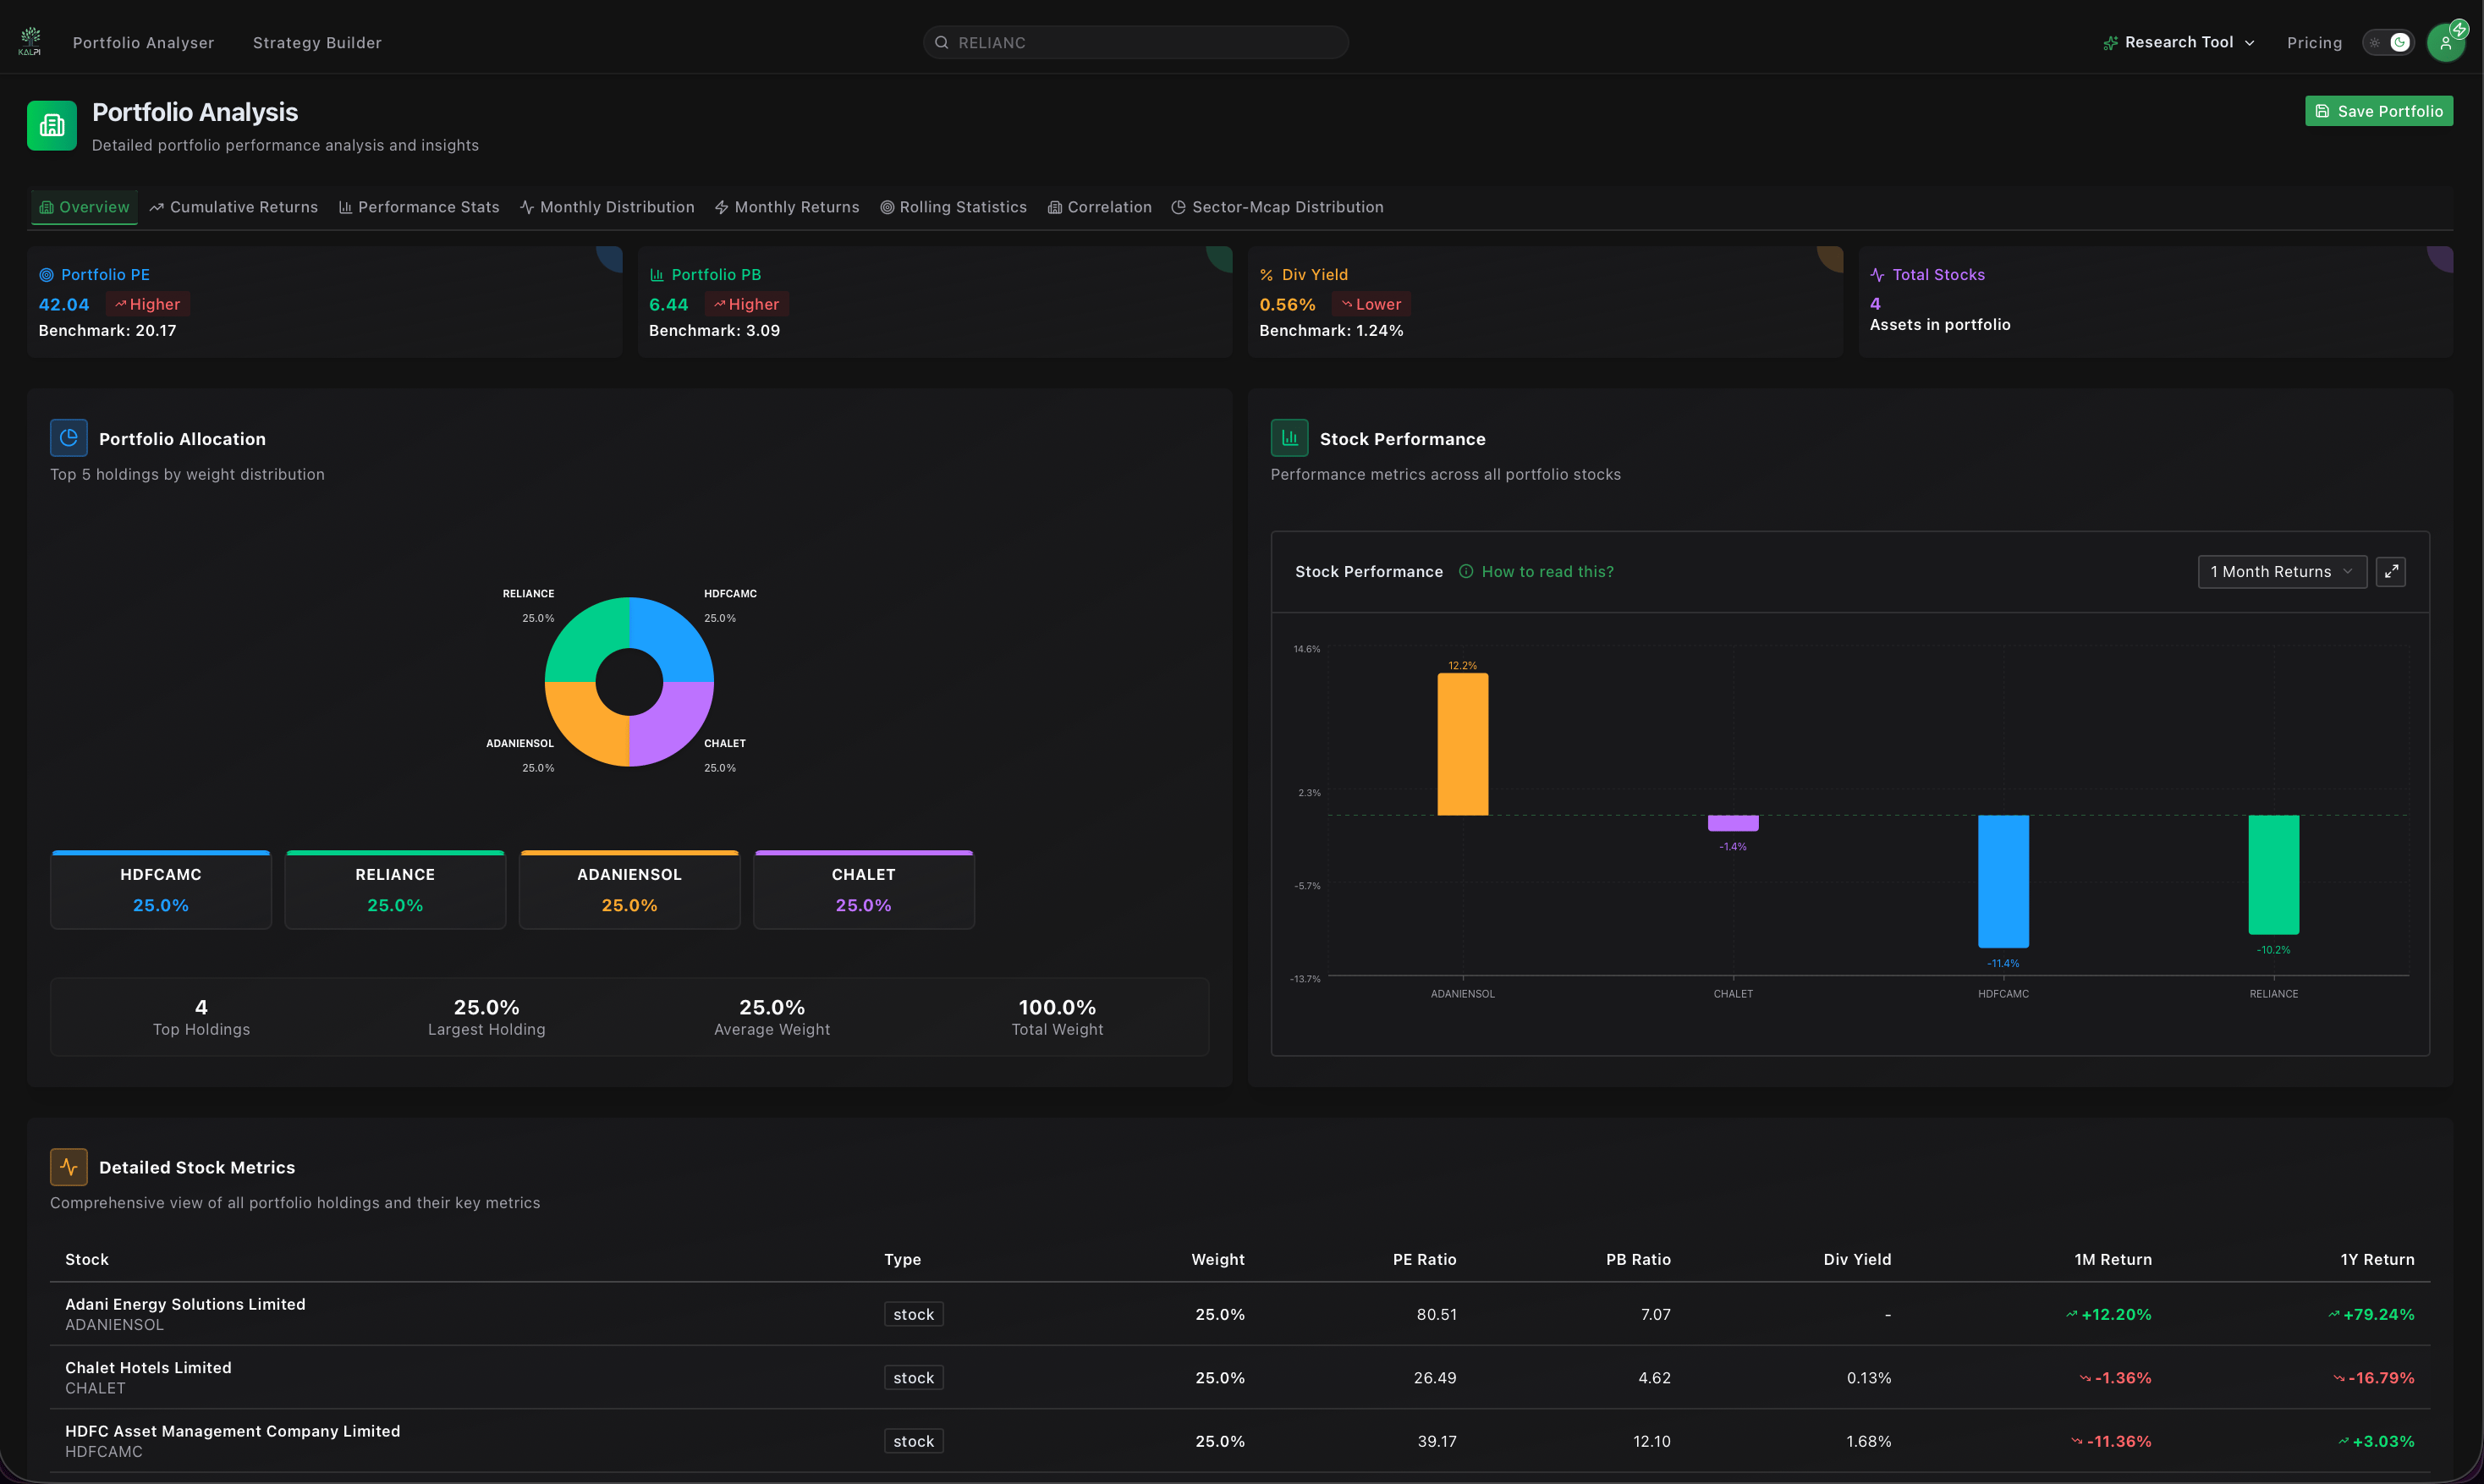
Provides a high-level summary of your portfolio's underlying core fundamental metrics and capital distributions.
 ### Core Variables Tracked:
* **Portfolio PE & PB:** Integrated fundamental valuations measured directly against the benchmark's multiple limits.
* **Dividend Yield:** Aggregate cash-flow yield derived from your specific asset allocation.
* **Visual Alignment:** Interactive portfolio pie charts map your current holding concentrations alongside individualized stock performance return profiles.
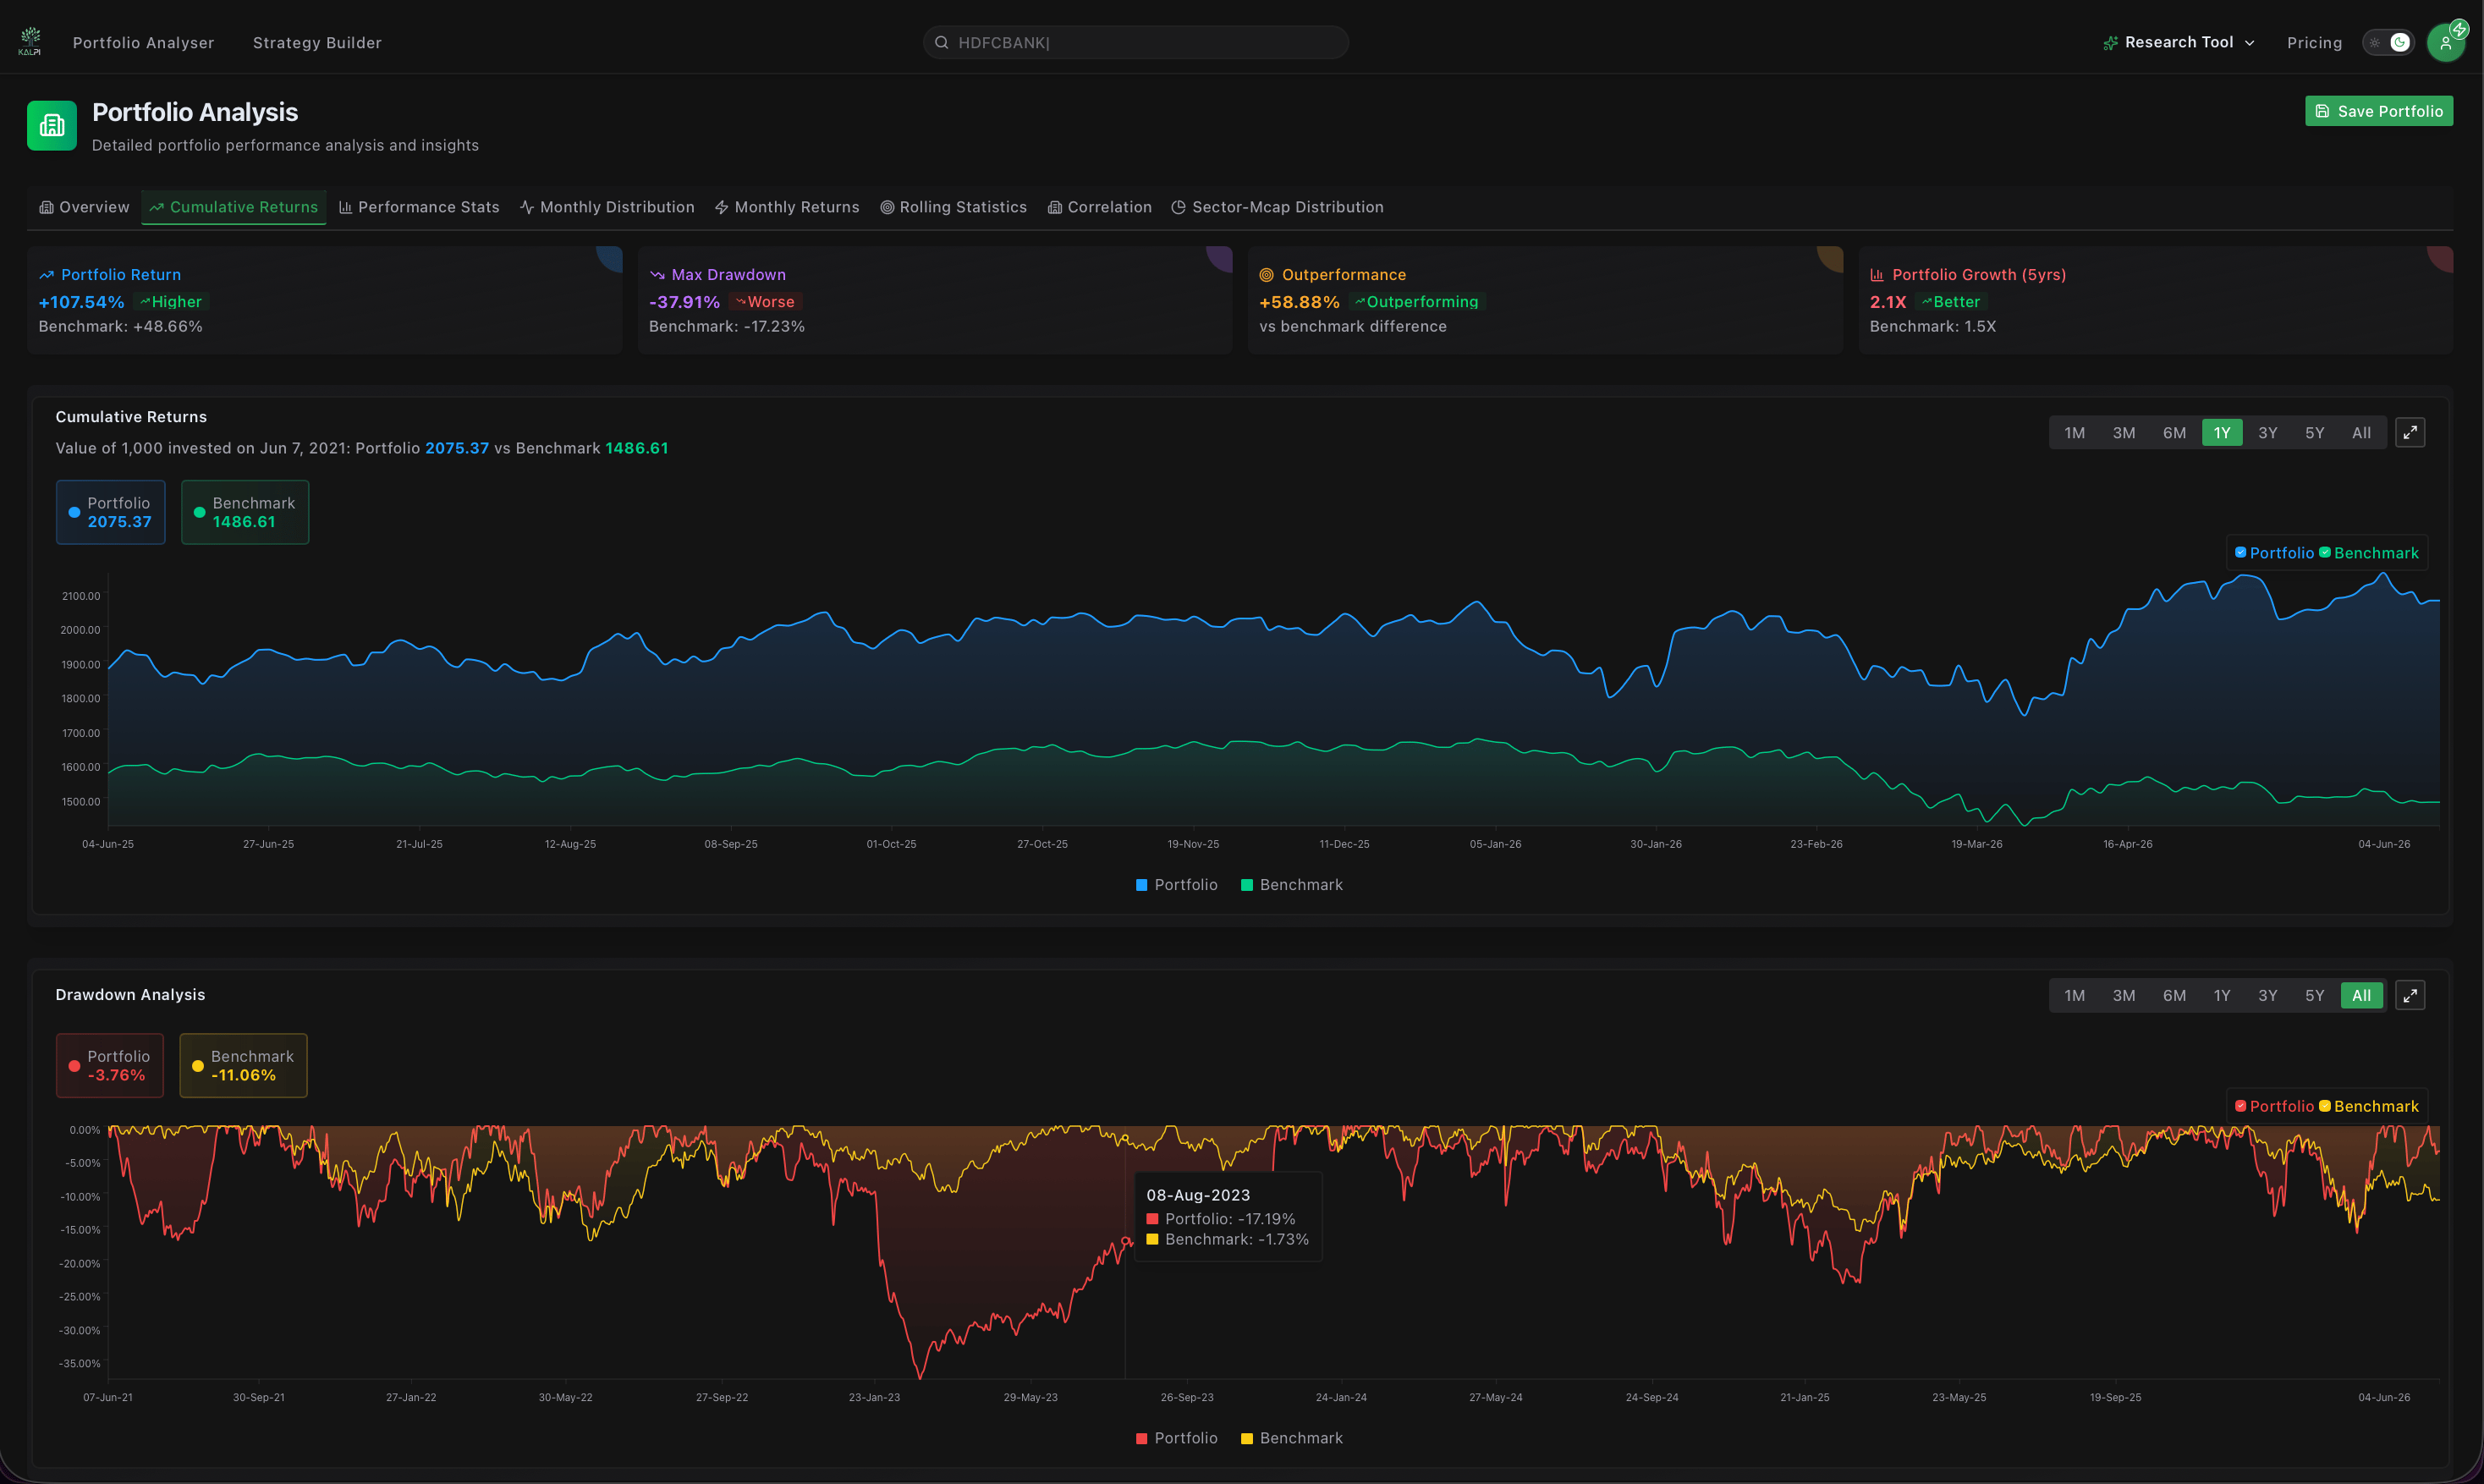
Tracks the absolute growth trajectory of your capital over time, providing direct insight into outperformance periods and structural downside risks.
### Core Variables Tracked:
* **Portfolio PE & PB:** Integrated fundamental valuations measured directly against the benchmark's multiple limits.
* **Dividend Yield:** Aggregate cash-flow yield derived from your specific asset allocation.
* **Visual Alignment:** Interactive portfolio pie charts map your current holding concentrations alongside individualized stock performance return profiles.
Tracks the absolute growth trajectory of your capital over time, providing direct insight into outperformance periods and structural downside risks.
 ### Core Variables Tracked:
* **Historical Growth Curve:** Interactive line chart overlay tracking your custom portfolio's valuation path against the benchmark over multi-year cycles.
* **CAGR vs Max Drawdown:** Compares your absolute compound annualized growth rate directly against the maximum peak-to-trough drawdowns experienced during market corrections.
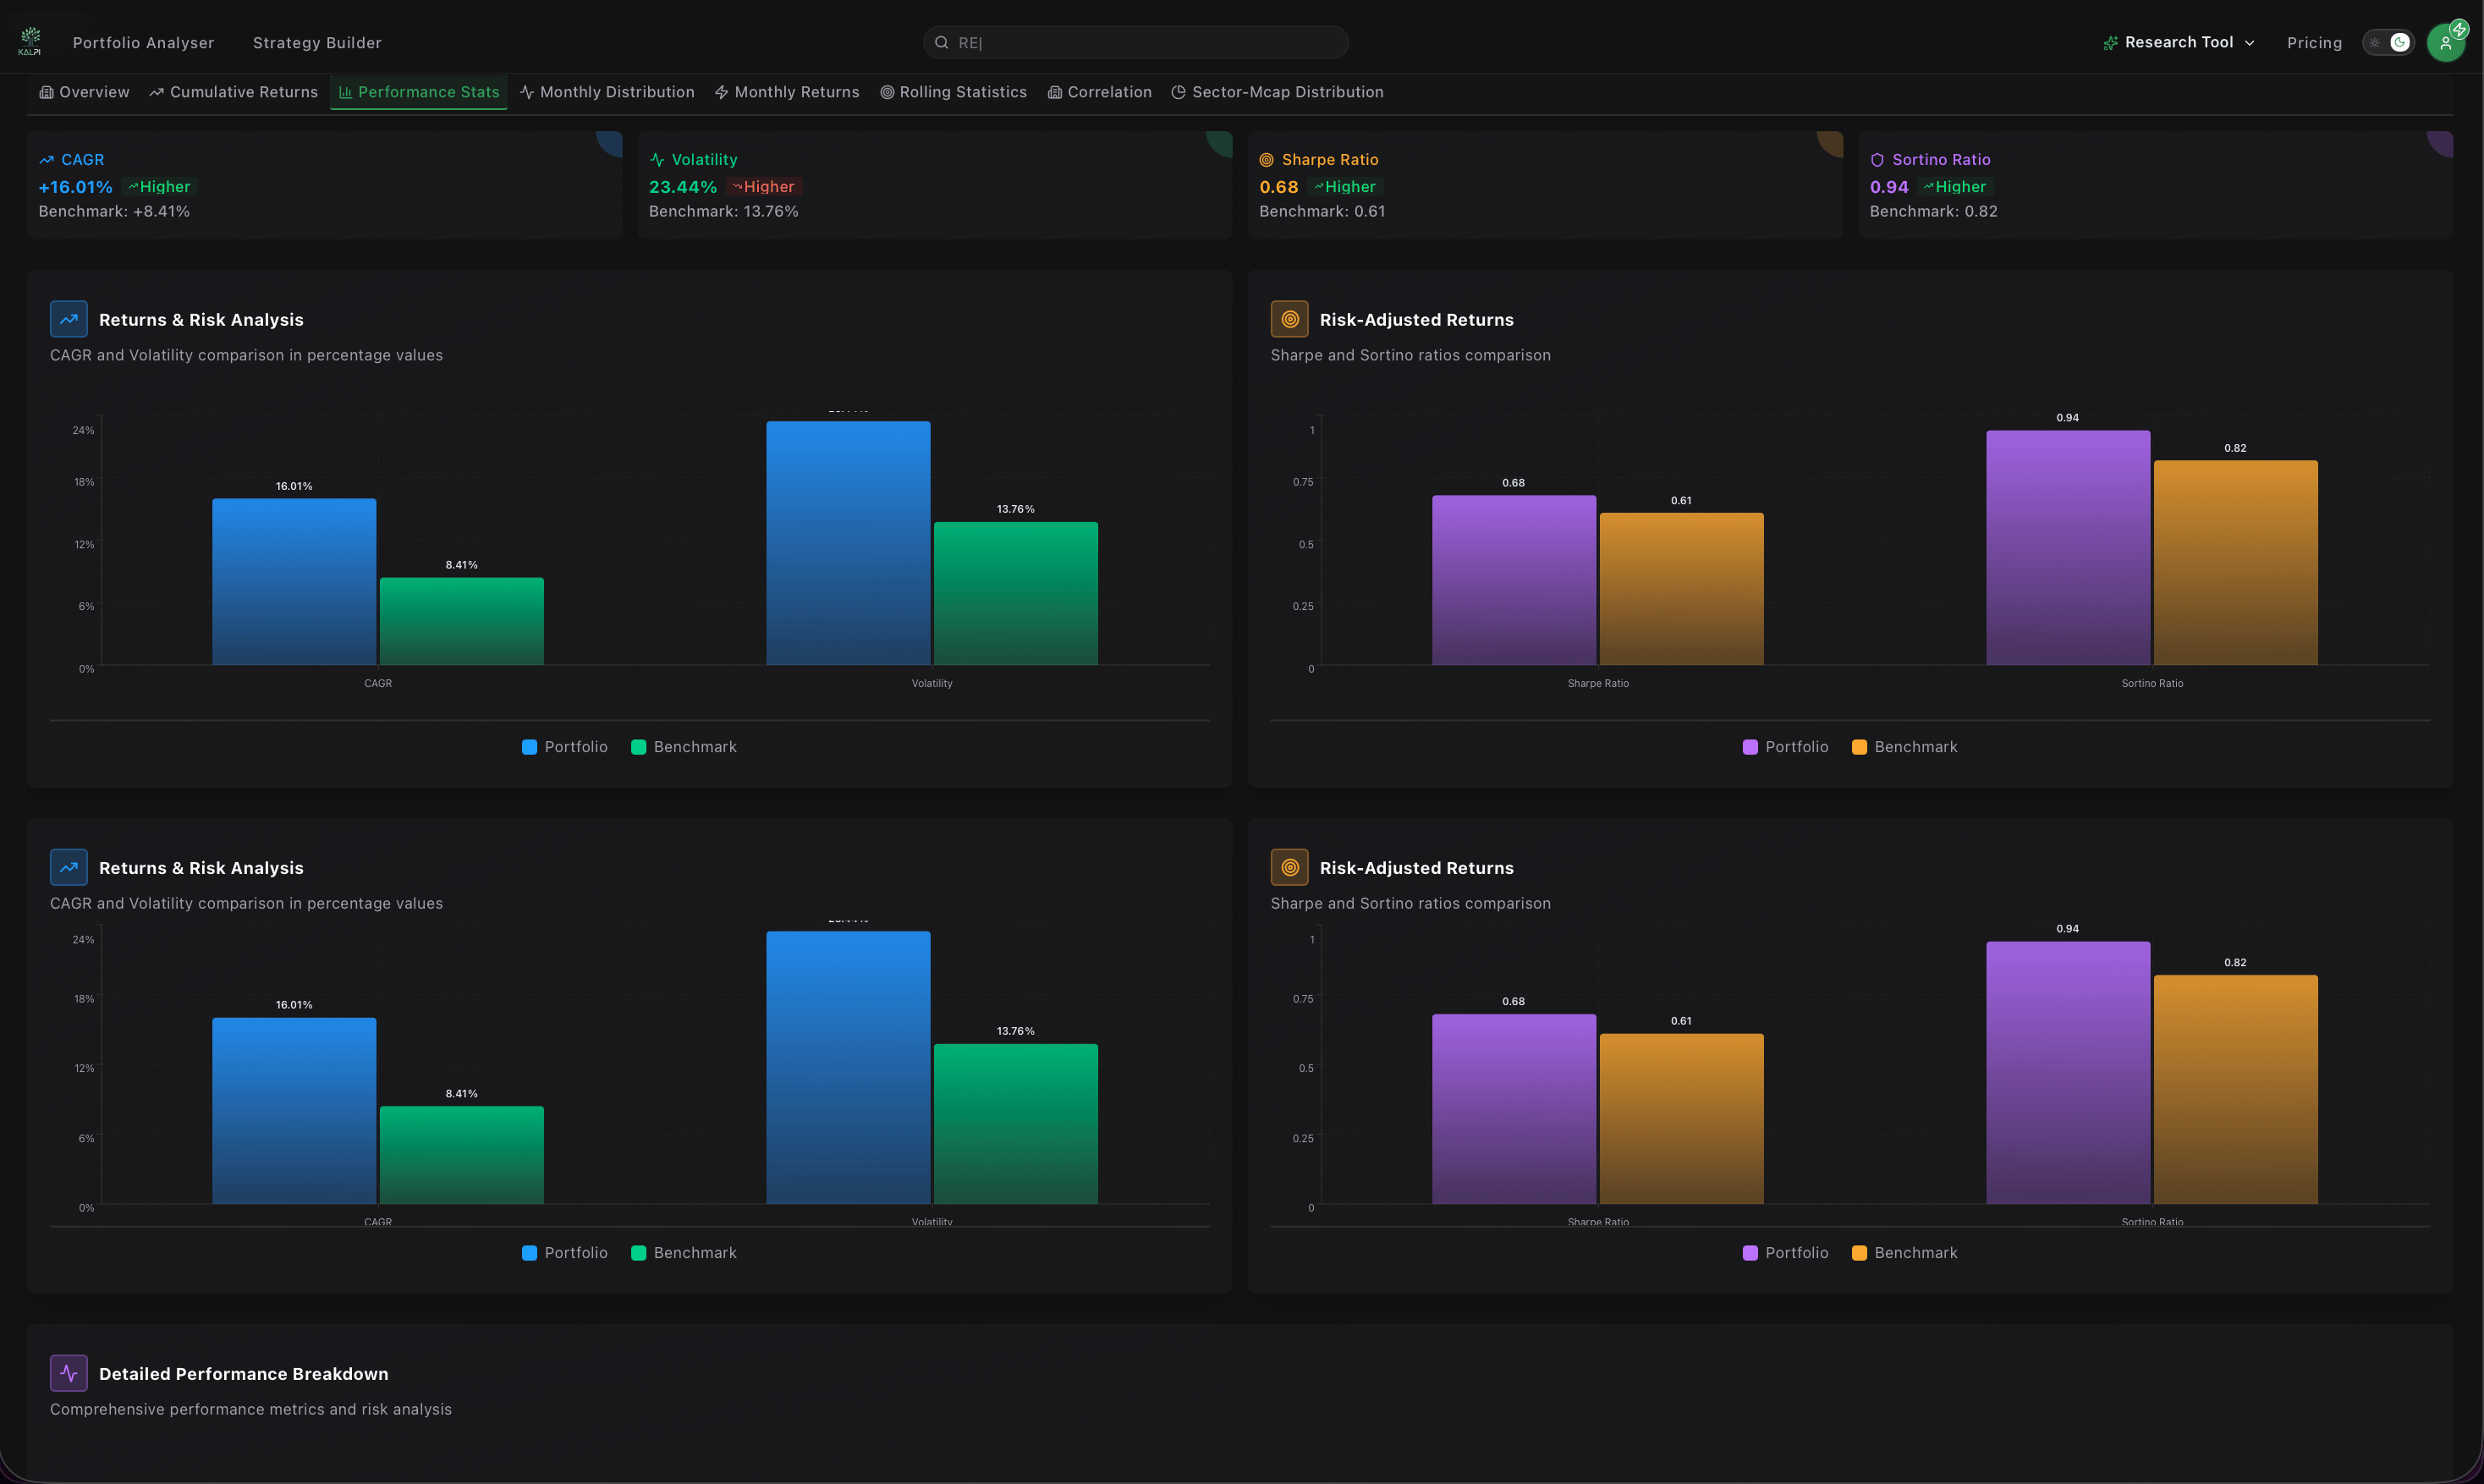
Looks beyond simple absolute returns to audit the true efficiency of your strategy based on volatility metrics.
### Core Variables Tracked:
* **Historical Growth Curve:** Interactive line chart overlay tracking your custom portfolio's valuation path against the benchmark over multi-year cycles.
* **CAGR vs Max Drawdown:** Compares your absolute compound annualized growth rate directly against the maximum peak-to-trough drawdowns experienced during market corrections.
Looks beyond simple absolute returns to audit the true efficiency of your strategy based on volatility metrics.
 ### Core Variables Tracked:
* **Sharpe Ratio:** Measures the excess return generated per unit of absolute volatility. Higher numbers indicate clean structural alpha.
* **Sortino Ratio:** Isolates harmful downside volatility rather than overall variance, offering a precise look at your true downside risk management.
Deconstructs performance into localized calendar time blocks to spot underlying patterns and check return consistency.
### Core Variables Tracked:
* **Monthly Distribution Histogram:** Breaks down the frequency of positive vs. negative months to map return consistency.
* **Color-Coded Return Grid:** An interactive heatmap layout presenting precise percentage gains or losses across every calendar month and year in your backtest history.
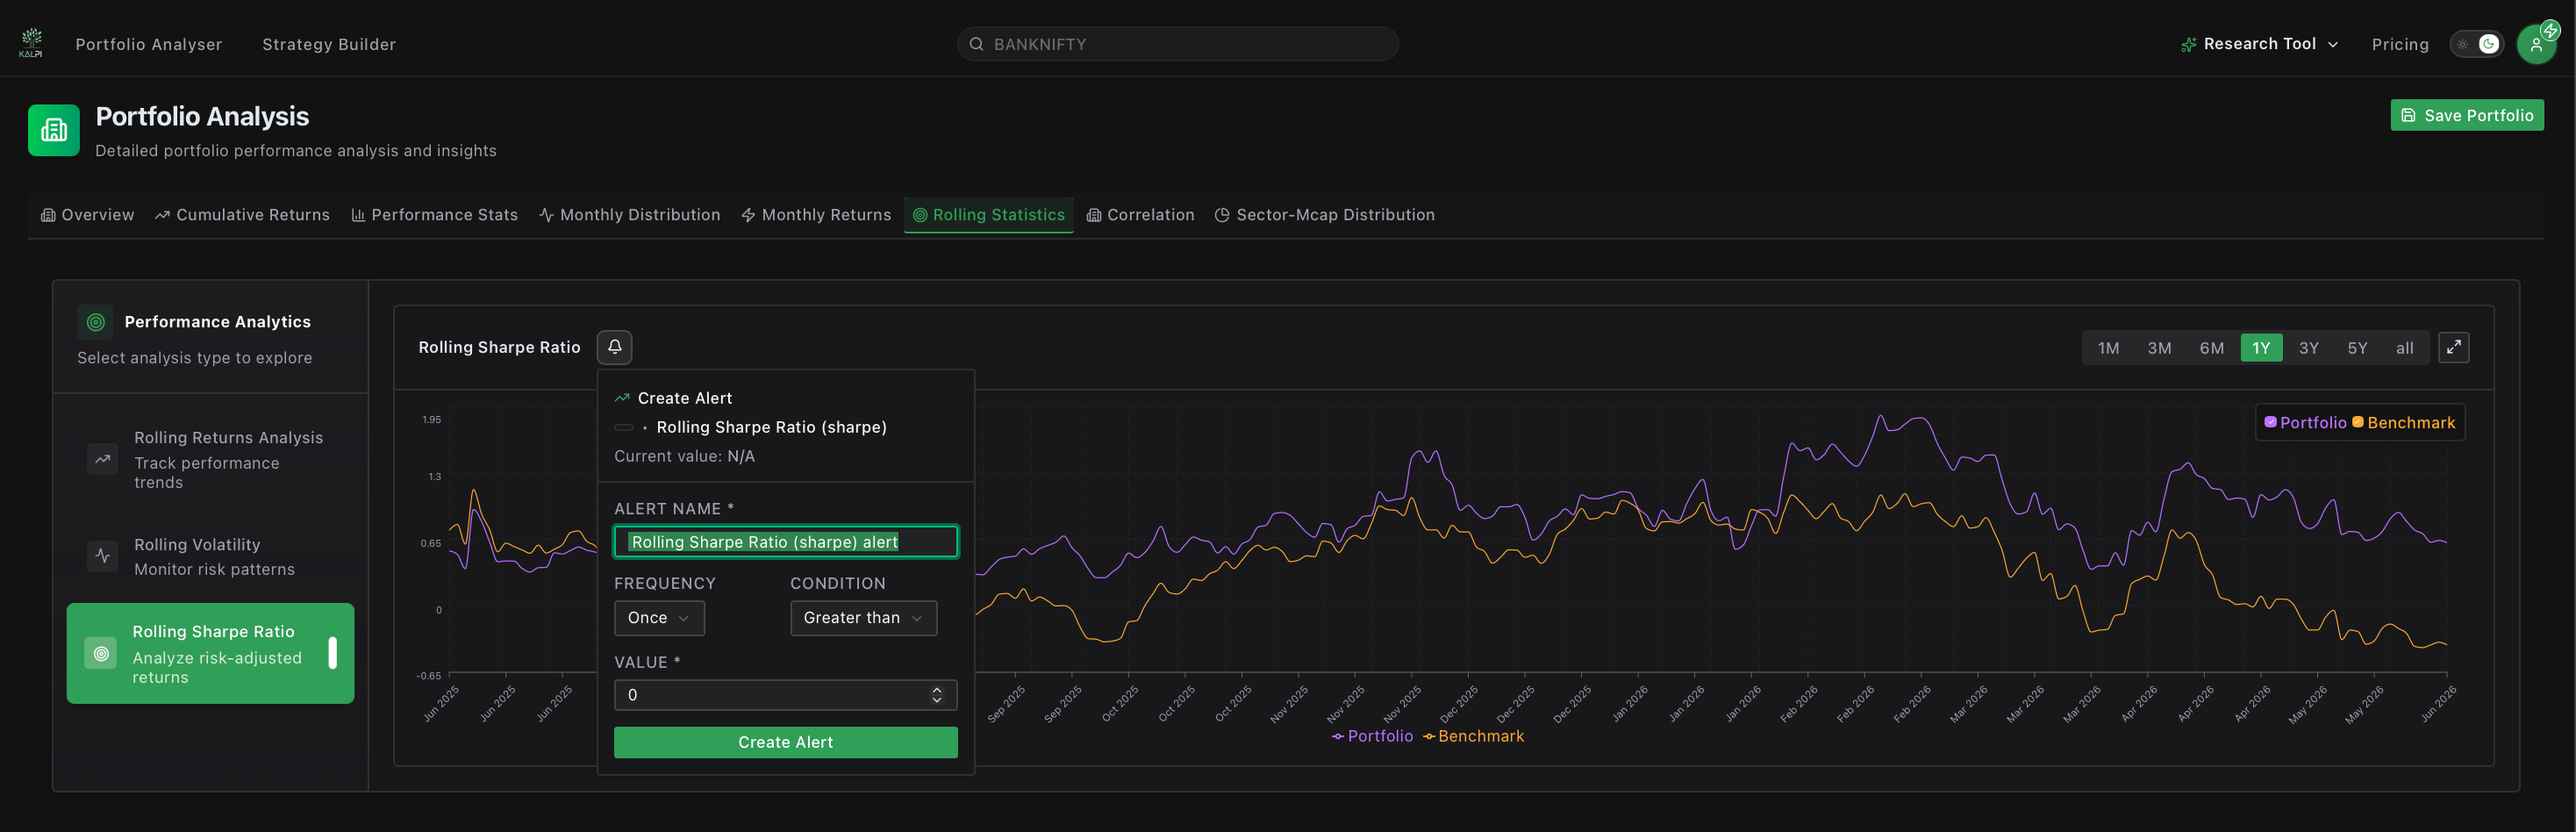
Audits structural stability by testing metrics across rolling holding cycles and calculating asset relationship behavior over time.
### Core Variables Tracked:
* **Sharpe Ratio:** Measures the excess return generated per unit of absolute volatility. Higher numbers indicate clean structural alpha.
* **Sortino Ratio:** Isolates harmful downside volatility rather than overall variance, offering a precise look at your true downside risk management.
Deconstructs performance into localized calendar time blocks to spot underlying patterns and check return consistency.
### Core Variables Tracked:
* **Monthly Distribution Histogram:** Breaks down the frequency of positive vs. negative months to map return consistency.
* **Color-Coded Return Grid:** An interactive heatmap layout presenting precise percentage gains or losses across every calendar month and year in your backtest history.
Audits structural stability by testing metrics across rolling holding cycles and calculating asset relationship behavior over time.
 ### Core Variables Tracked:
* **Rolling Returns Analysis:** Tracks how your average yields fluctuate across constant rolling periods to remove endpoint bias from your data.
* **Correlation Matrix:** Monitors the statistical relationship between your underlying assets to confirm your portfolio is genuinely diversified.
Maps your asset allocation rules to reveal underlying structural exposures and identify hidden systemic factor risks.
### Core Variables Tracked:
* **Sector Distribution:** Donut charts detailing exactly how your capital is distributed across major industries (e.g., *Capital Goods, Power, Oil & Gas*).
* **Market Cap Allocation:** Breaks down exposures into Large, Mid, or Small-cap tiers, generating an absolute *Diversification Score* out of 10.
### Core Variables Tracked:
* **Rolling Returns Analysis:** Tracks how your average yields fluctuate across constant rolling periods to remove endpoint bias from your data.
* **Correlation Matrix:** Monitors the statistical relationship between your underlying assets to confirm your portfolio is genuinely diversified.
Maps your asset allocation rules to reveal underlying structural exposures and identify hidden systemic factor risks.
### Core Variables Tracked:
* **Sector Distribution:** Donut charts detailing exactly how your capital is distributed across major industries (e.g., *Capital Goods, Power, Oil & Gas*).
* **Market Cap Allocation:** Breaks down exposures into Large, Mid, or Small-cap tiers, generating an absolute *Diversification Score* out of 10.